The sump used to always be a stressor for me. This time of year I would hear it go off all the time and I would worry what if it got stuck? How many times is it really running?
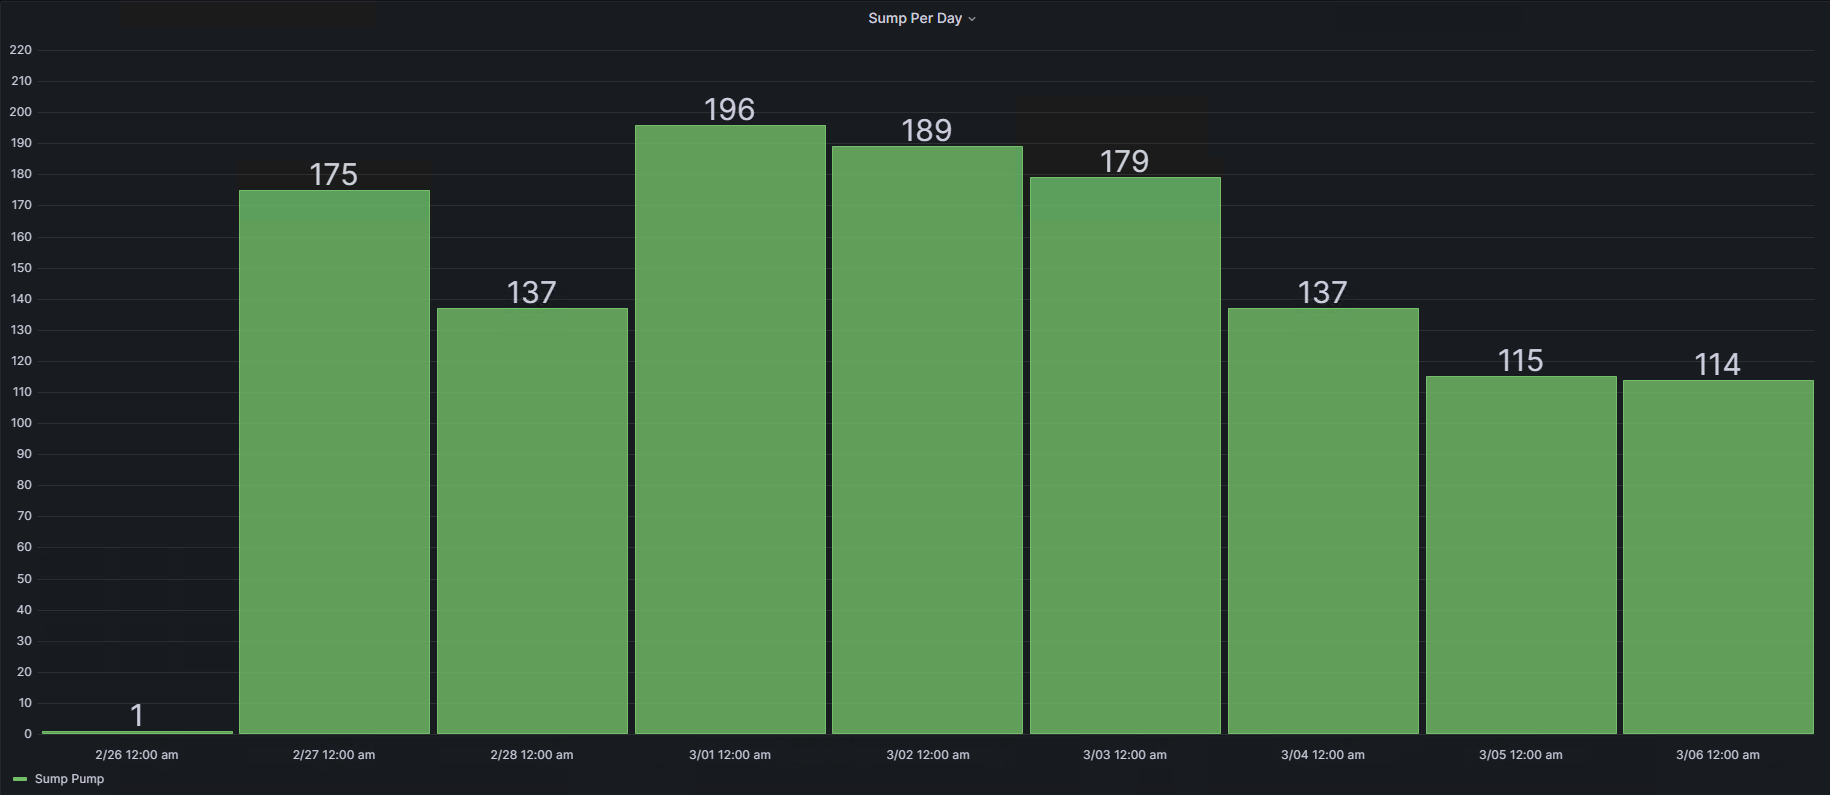
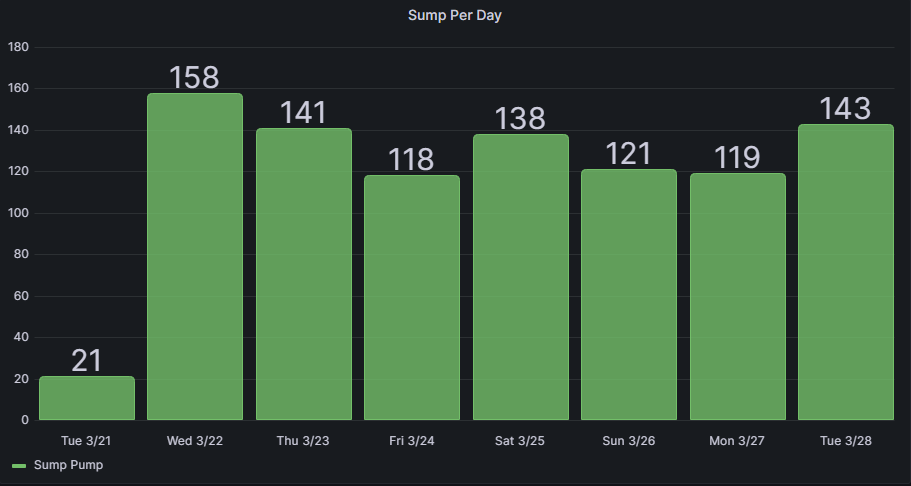
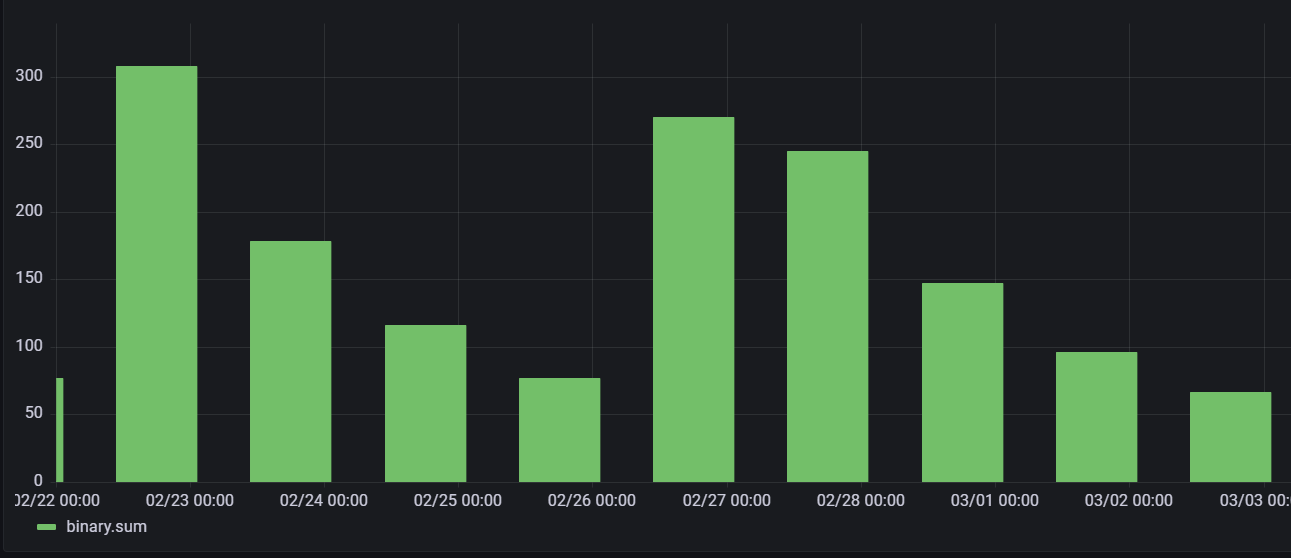
One point of monitoring the sump is tracking it from an energy reporting smart outlet. I use the energy reports to flip a virtual switch on/off via RM, which goes to InfluxDB, and then count the on/off changes in Grafana to make a chart. Can you tell when it warmed up, started raining and all the snow started melting? Thats a lot of water!
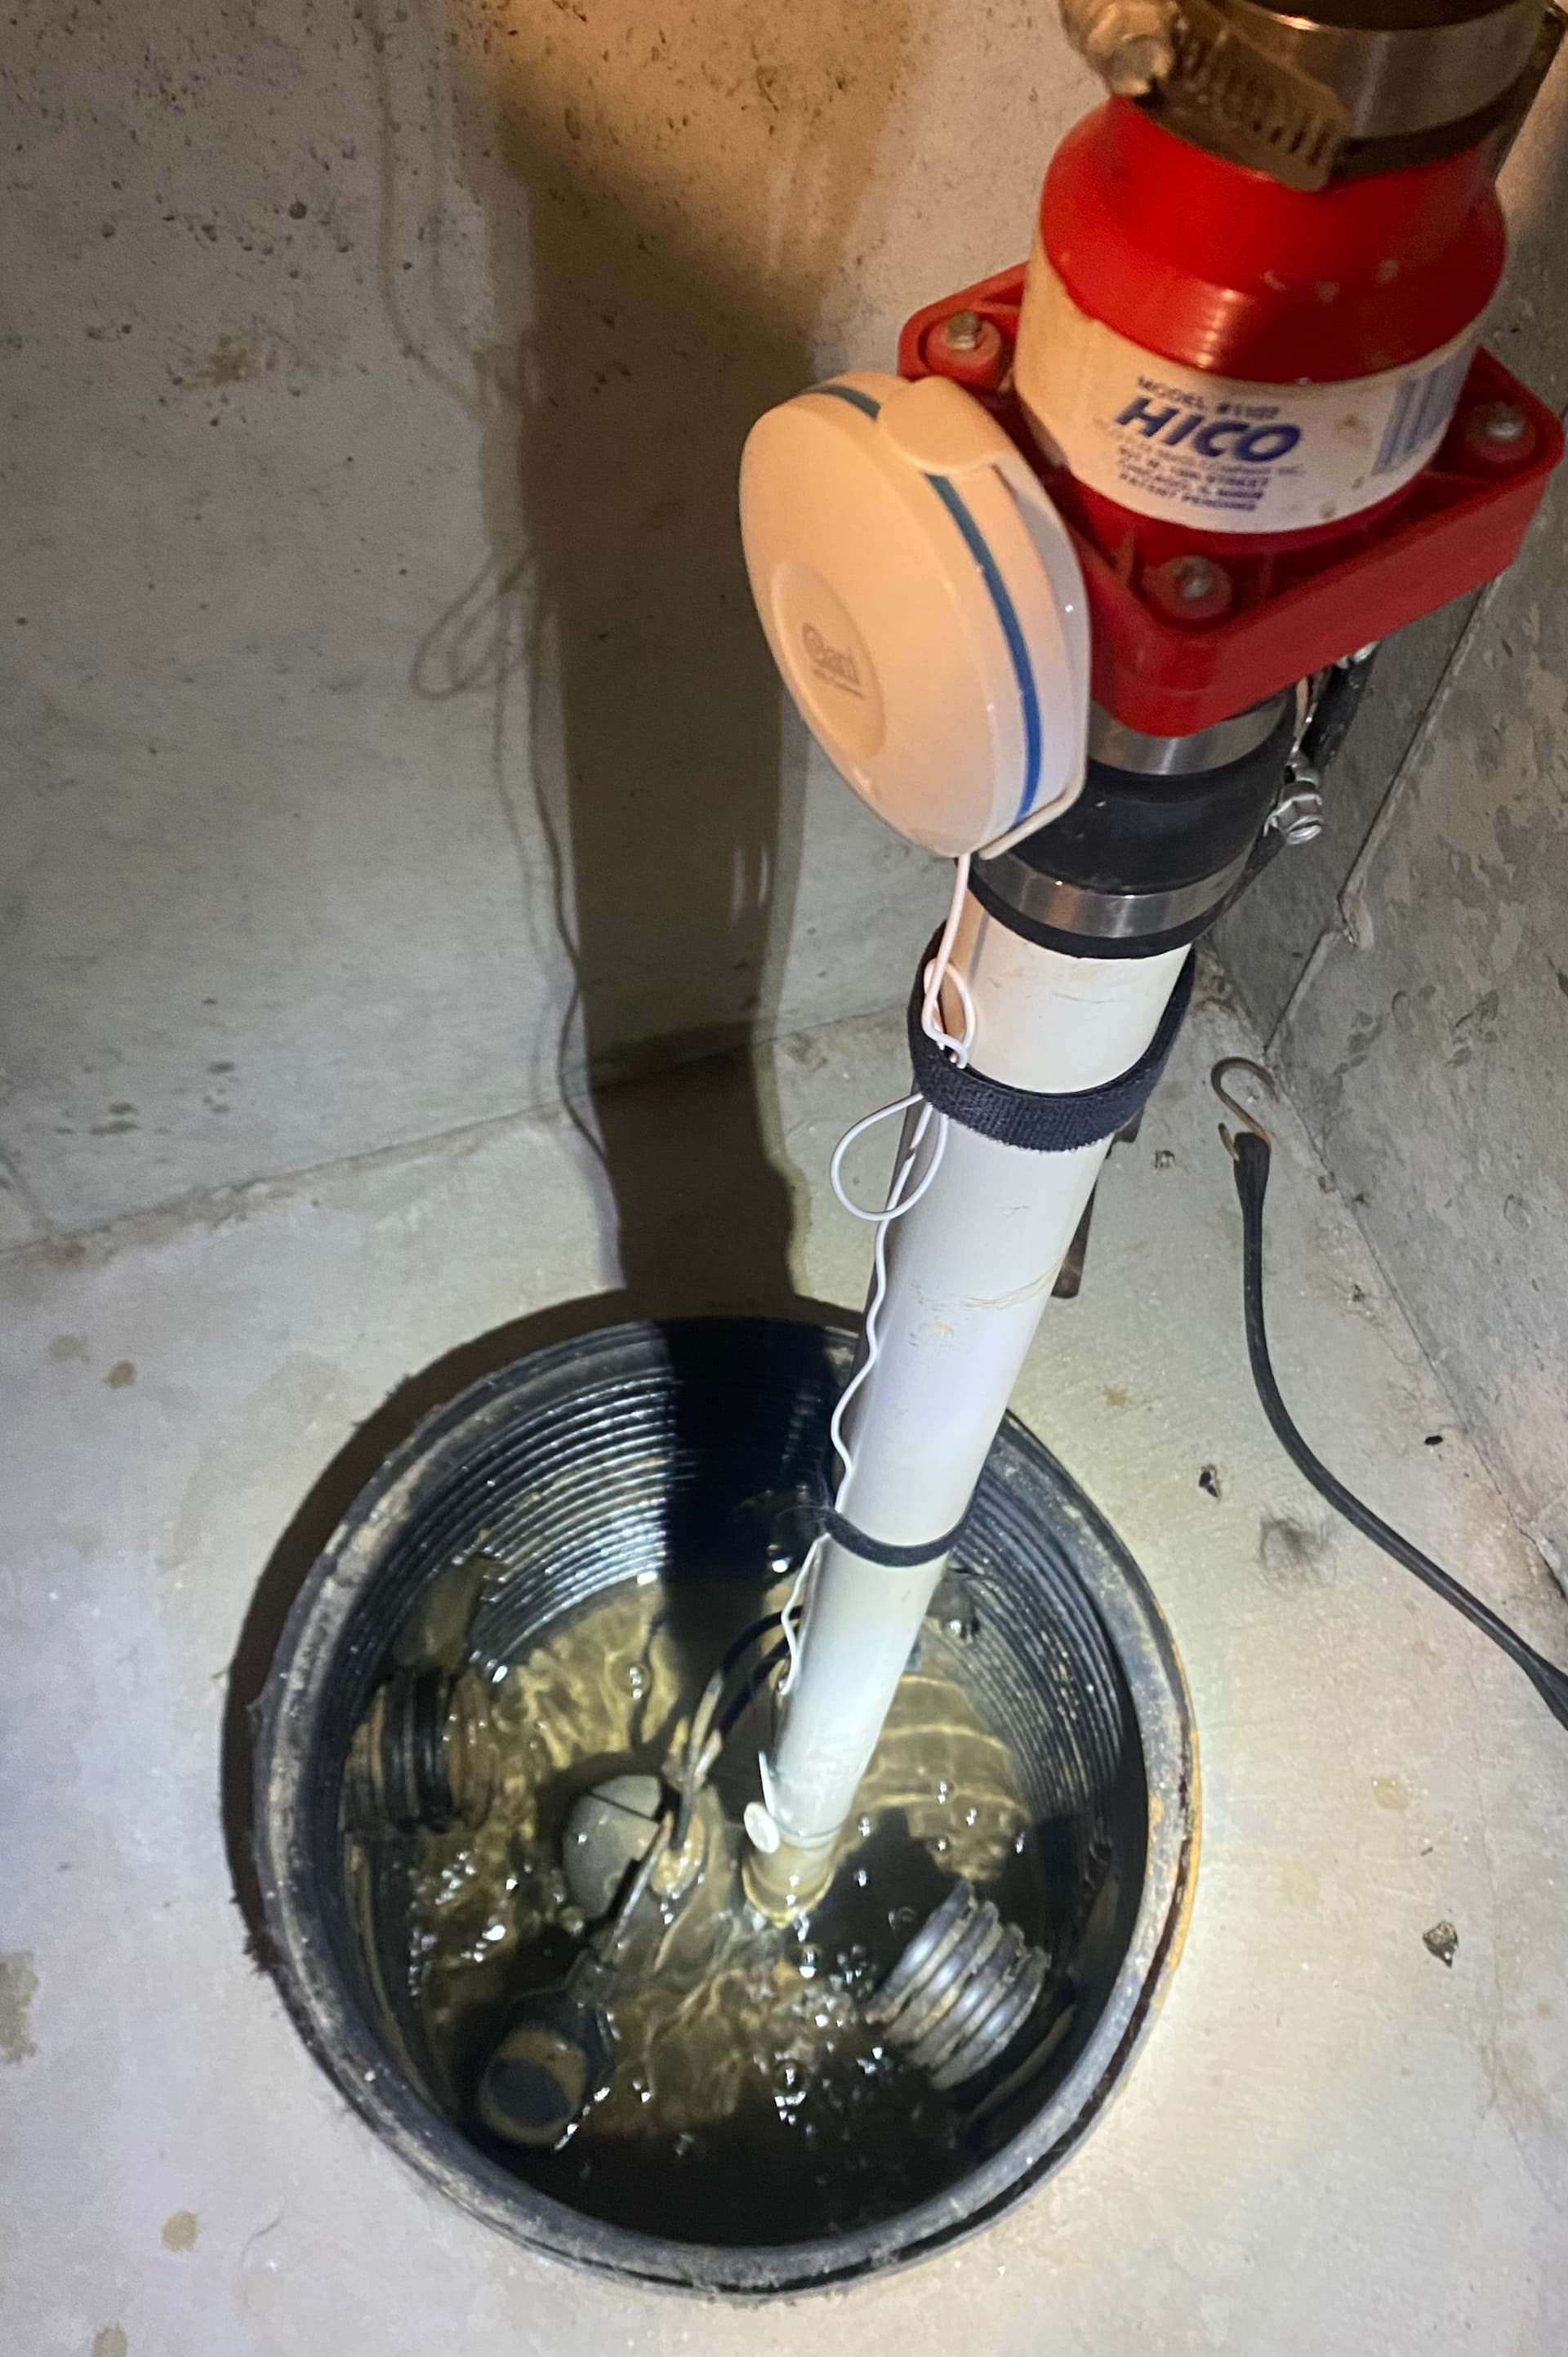
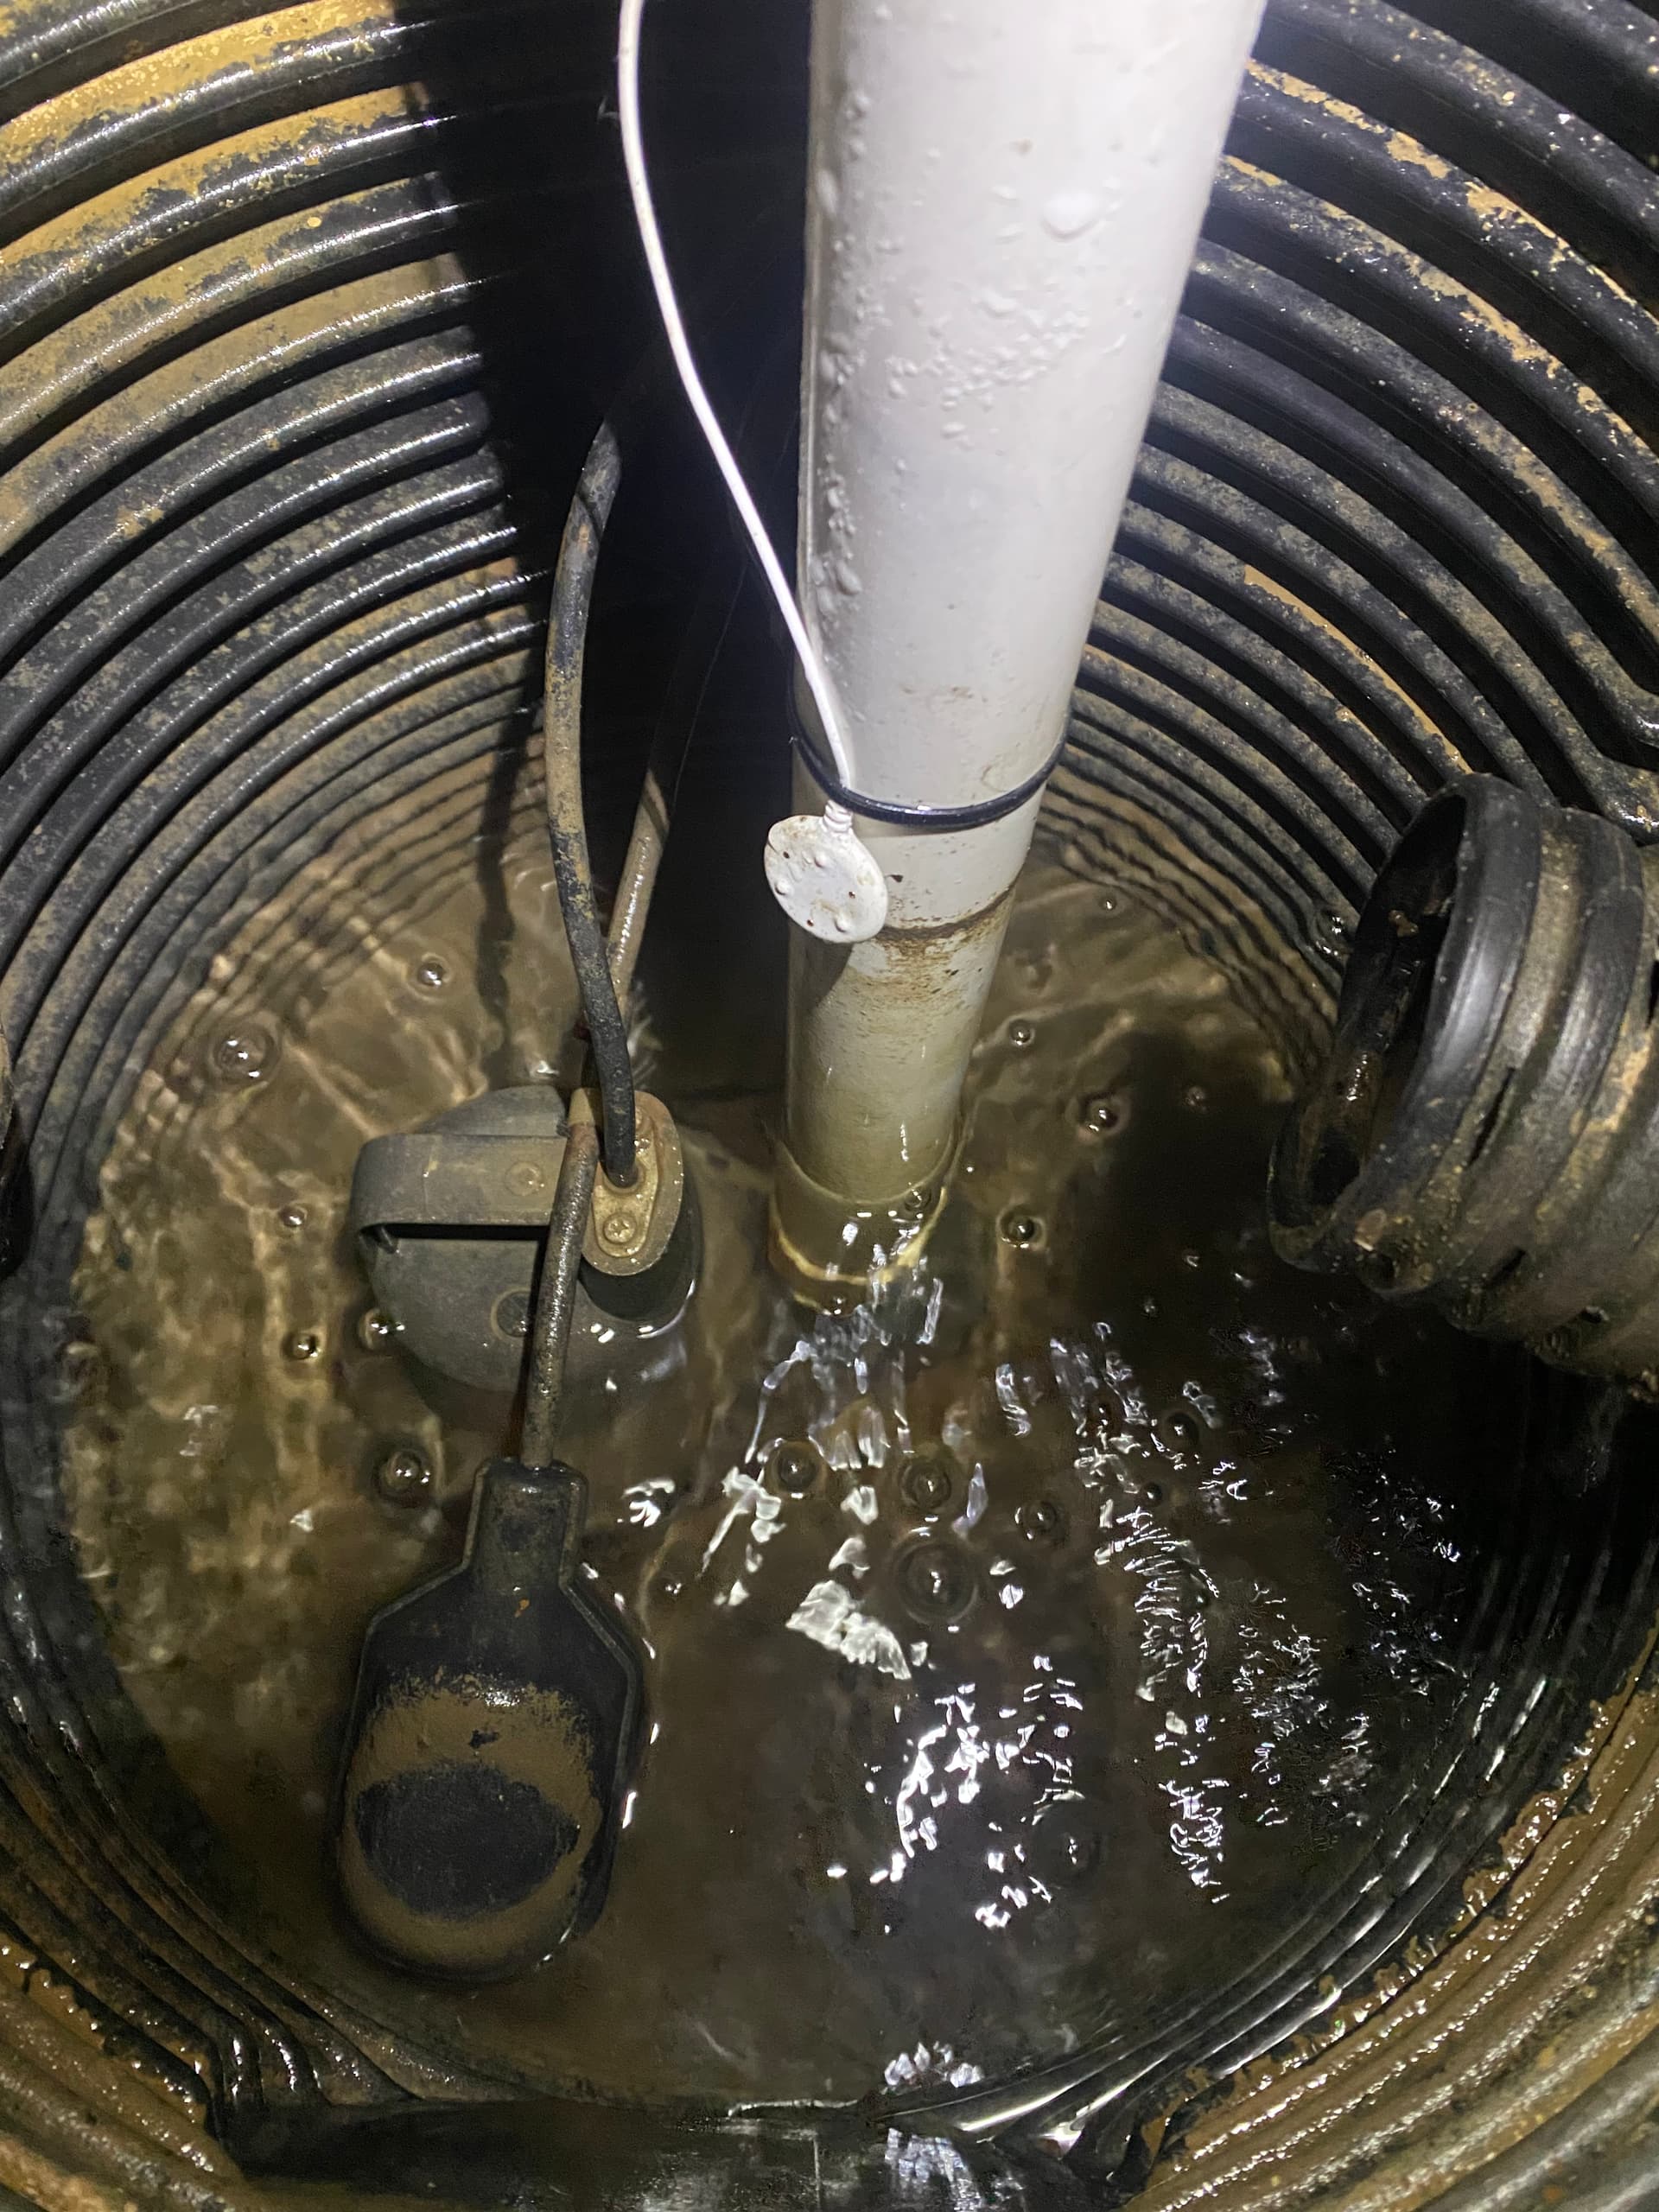
My other monitoring point is a leak sensor mounted just above the high point before the sump runs. If this ever goes off I should have a few hours at least to prevent flooding. The excess water will start filling up the feeder pipes so there is a lot of room for extra water before it overflows the pit. Pictures Below.
You will need to change the time zone, bucket, and deviceName to match your setup. May need to change the measurement name also if its not a switch status.
Great post and one additional thing I do is have a power source indicator to know if the circuit has faulted. I have an Aeotec Water Sensor 6 that has a backup battery and tells me if power changes from mains to battery since my sump is on the same circuit as a bathroom above with GFI.
Do you burn through pumps and/or pump switches with that many cycles per day?
I had a terrible time with the built in float on a Zoeller sump pump welding the contacts with so many cycles. I first switched to a mechanical vertical float, but that only lasted about a year before frying contacts (at least it was easier to replace than an entire pump). I have since standardized on a dual float switch that has an adjustable run time. Basement Watchdog Dual Float Switch | Basement Watchdog
As far as I know this is the original pump and float switch from 1997. The pump is your typical pump that runs whenever power is applied. The float is just mounted to a cord which is attached to the top of the pump with a little clamp, and is adjustable for length to set the on/off height. When it goes up it kicks on and when it goes down it shuts off. I have adjusted mine so that it waits for the water to get just below the tubes before running, and then it nearly empties the pit. So it cycles less frequently that way. Its got to be at least 4-5 gallons per cycle.
I do like the float you posted, if I ever need to replace mine I will check it out.
Oh also BTW this is not typical, we had a bunch of snow and it warmed up and rained all at once. For most of the year it just sits there waiting for rain.
@jtp10181 Noticed you posted pictures of your leak sensor after my post above and see you are using the Dome sensor with the round sensor. Please test that often because I had two of them fail on my - one covered by Dome's warranty and after the second failed I gave up and bought the Aeotec version.
Its actually the "Neo Coolcam" model which might be a knock off of the dome. I was going to get the Ecolink with the lead on it originally but it was out of stock everywhere at the time.
And yes, I was planning on testing it tonight once the wife is home. Don't want all the alarms going off on her phone while she is at work!
Thats how mine works as well, Outlet > RM > Virtual Switch > Node-Red > Influx > Grafana. I just left out the middle explanation and jumped right to Grafana.
I have a similar situation. I’ve installed multiple water sensors on two HE7s.
This is beyond the scope of monitoring, but I’ve installed a transfer switch to control running the pump from utility or an inverter connected to a battery. I also have a Wayne DC backup pump with separate discharge.
For me redundancy is key, and testing everything monthly.
I have two sump pumps. One is the primary and the other is secondary. I do not monitor the primary pump as the secondary pump will start up if the primary fails. The secondary also runs if there is high rainfall. I have a Zooz ZEN15 plug outlet to monitor the power to the secondary sump pump. If the secondary pump starts up, it will trigger an alert message on my chime/sirens.
That's genius, I want one now. But why they heck are they so expensive, more than an electric pump even. Its literally just a fancy automatic valve with a nozzle!
Because it most likely never get used and last forever ..
it not a product that is "replaced every x so years" so company got to make money on something that will never likely get replaced and a new one purchased from them again in near future from same customer.
Electric motor have many moving parts plus parts that can easily rust some bearrings that can wear out so it'll most likely get replaced in less than 10 years range keeping the company profit up.
If your secondary pump is running off a 12V battery how about a Zen17.
Power the relay from the 12Vdc supply and parallel the pump power line to the input (VC) for on/off status.
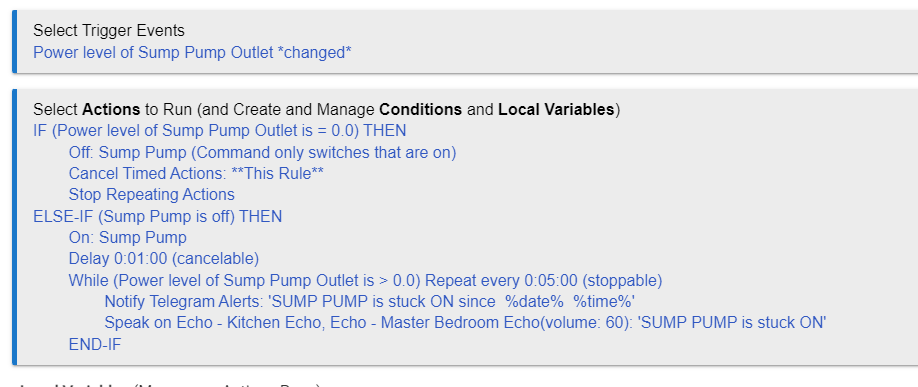
That's a good one, I do the first one, but just in general without the rain check. I have a notification if it stays ON for more than 60 seconds at any time. Indicating it is stuck, which could burn out the motor. Typical run time is around 10 seconds to clear the entire pit.
That sounds like an interesting idea (I even have a spare ZEN17).
I might look into that, but I got the Basement Watchdog Big Combo CONNECT® | Basement Watchdog with Wifi connect option and I'm not sure that I want to void my warranty by splicing into the wiring just to gain monitoring capabilities.