If I'm understanding your intent correctly, you don't need to splice to monitor power (and therefore on/off). You can do it through a simple wall wart that has a power monitoring capability. Or you can install a more robust power monitoring solution like IotaWatt, which is what I do.
That's what I do for the main pump (using a heavy duty ZEN15), but I don't have the same monitoring on the 12V backup pump.
Warranty schmarranty ![]()
From this pic from the manual it looks like a pretty standard connector going from the pump to the control box on top of the battery.
Just make a little adapter/splitter (might be something on Amazon?) to put between your pump wire and control box, and wire in your relay to the system.

If you can get a more detailed pic of the plug/connector someone may know exactly what you'd need to add on a HE compatible device.
Lol, I looked at it earlier and determined that would probably be the path of least resistance. Would almost definitely void the warranty though. I figured that using some of my Wagos would do the job.
That said, I already get alerts from the app, so I'm waffling between "should I" and "could I"

My approach for now is a vibration sensor on the pump outlet pipe to track pump cycles as well as a leak sensor in the sump well. A large inverter, battery and automatic power transfer switch. I started with a Zooz Zen15 Power Switch to monitor power to turn on a virtual switch. At one point the Zooz turned off without an apparent command. That was an unacceptable risk. The switch had to go. Hubigraphs to monitor the pump cycle time with a virtual switch. A whole house generator this summer and two pumps. both online at two different float heights.
This is the wet season for me, in the driest part of the summer my longest cycle times are about four hours. The shortest get down to 3-4 minutes.
2 Likes
If I’m not mistaken, you can monitor a 12VDC circuit with something like a MIMOlite by FortrezZ.
@jtp10181 Nice work on the system  My brother has a similar issue with a hyperactive sump in summer, and one basement flood that caused about $30K in damage.
He uses the Zoeller system Aquanot® Spin 508 | Backup Pump Systems | Zoeller Pump Co. which has a nice little control system, 12 V battery charging and the additional 12 V pump. It's worth taking a look as it does give him some peace of mind going forward. The new system (we updated his setup literally last night) runs the 12 V pump once a day for a few seconds, and warns if any issues.
1 Like
For anyone that has had a failed physical switch on their sump... do yourself a favor and get an electronic switch. I went through a pump every 1-2 years because the switch would quit working. I got tired of it and got an electronic switch (it's essentially a relay that goes inline with the sump power plug), and used a piece of wire to keep the physical float switch in the on position. It's been there for over 10 years now and isn't showing any sign of slowing down.
I have a second sump as a spare along with the parts needed to install it because I have a finished basement, just in case it goes out when stores are closed. Worst case scenario I drop that into the pit and put the pipe into my utility sink. Never needed the spare yet though.
Thanks, I'm copying this!
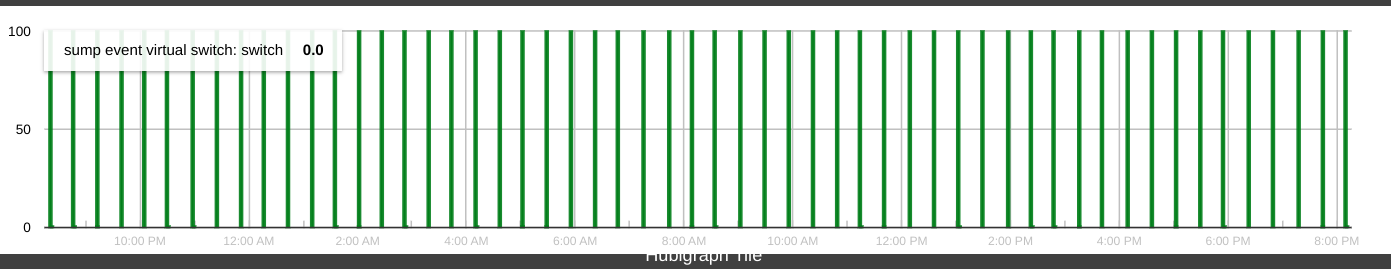
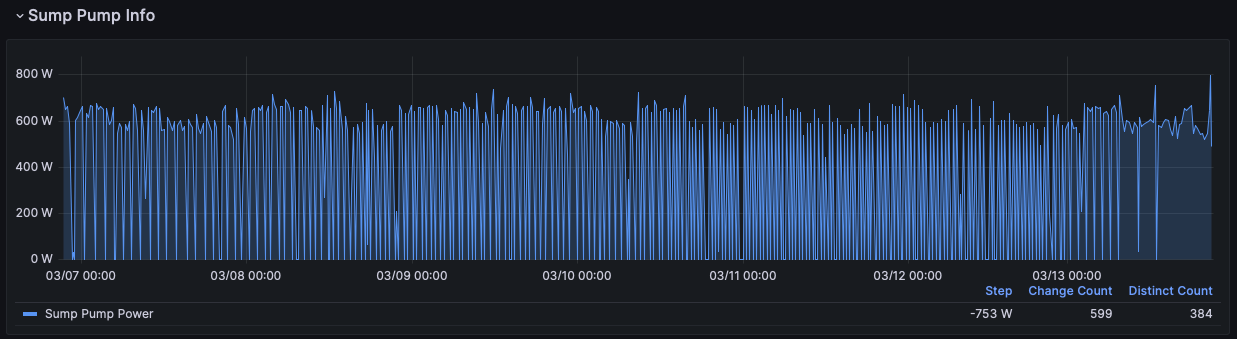
I just have a Grafana chart using InfluxDB data where it shows me the mean power. Was thinking of adding a Grafana alert but I'm borrowing your rule instead.
Can you tell it's been really pouring the past few days?
1 Like
Yeah and if you add the virtual switch to toggle on/off from my rule you can add a counter chart to Grafana. Makes for a fun little metric. Never would have realized it goes off almost 200 times in one day without it!
1 Like
I’ve had the opposite experience – prefer physical switch over electronic. Electronic is susceptible to lightening surges. Is your installation DYI, or a commercial product? I am open to changing. Some of the electronic solutions have dry contact terminals.
Mine is a commercial product. It's at least 10 years old so I have no idea what brand or if it's even still being made. It's very simple, it has a single wire that you attach to the pipe above the pump. When the water reaches it, it detects the completed circuit through ground and turns on the relay so the pump runs. It turns off when the amperage draw from the pump lessens because the pump ran out of water. It's been through brownouts and lightning storms and hasn't missed a beat. It's probably saved me at least a thousand dollars by now in pumps, installation materials, and time, not to mention not ever having had a finished basement that flooded.
I just noticed this string and just thought I'd mention my setup. I got into smarthome stuff trying to find a way to track my sump pumps since we had one basement flooding in the past. I use a Konnected.io NodeMCU board for this. It is cheap, simple and I use it for 6 inputs and 1 output. I have two identical sumps at either end of the basement so this was a low cost option with lots of flexible inputs. They've been going for over 5 years now. He advertises them as a low cost alarm system, but I didn't have an alarm system and they are awesome for sump pump monitoring.
The output is connected to a 12V Honeywell alarm that we can hear if we are home. The 6 inputs are connected to 6 Amazon float switches arranged vertically on a PVC pipe down in each pit. The bottom switch is as low as I can get it and I use it just for a notification every 12 hours on my phone to tell me the pit has water. That lets me know to monitor the pits during the day. The next 4 switches are in the range of the pump going up or down. (There were 6 inputs and a 12 pack of float switched so thats what I did.) When it pumps, the lower of the 4 just will just register dry. And just after the top one of the 4 gets wet, then it pumps. That makes for a pretty picture of changing color icons as the water goes up and down and I can see how fast it is filling. The top (6th) switch is just below where the battery backup pump kicks in, and it lets me know there is an issue. If it closes, Alexa will also announce there is an issue and the output on the board triggers the alarm via Hubitat rule.
Another rule is triggered when the top of the four registers dry followed by the third switch within a few seconds. They only go dry that fast after one another when it has pumped, and this adds one to a counter variable displayed on my dashboard. There is a reset counter button on the dashboard as well to reset the values when the storm is over.
The newer Watchdog battery backup pumps also have a dry contact relay when they trigger, so that is fed to a different Konnected.io NodeMCU that had an open input in the same room. That will also trigger Hubitat Notifications and Alexa announcements. In case of power failure in the night, I do have a simple battery powered water alarm with a long probe. The probe goes down into the pit about the same height as the 6th float that triggers the alarm. I cut the wire on that battery alarm and mounted it up in our bedroom since we had some unused old thermostat wires that ran to our bedroom from the utility room. The flooded basement happened long ago in the middle of the night during a power outage when we didn't have a battery backup pump. That storm dropped 15 inches at our house and almost 30 inches in areas nearby.
Our sumps may only run during spring thaw (Minnesota) and about 5 thunderstorms a year. But for some of those storms, they may pump 100 to 200 times because we usually get at least one annual thunderstorm that drops 4 inches of rain or more.
1 Like
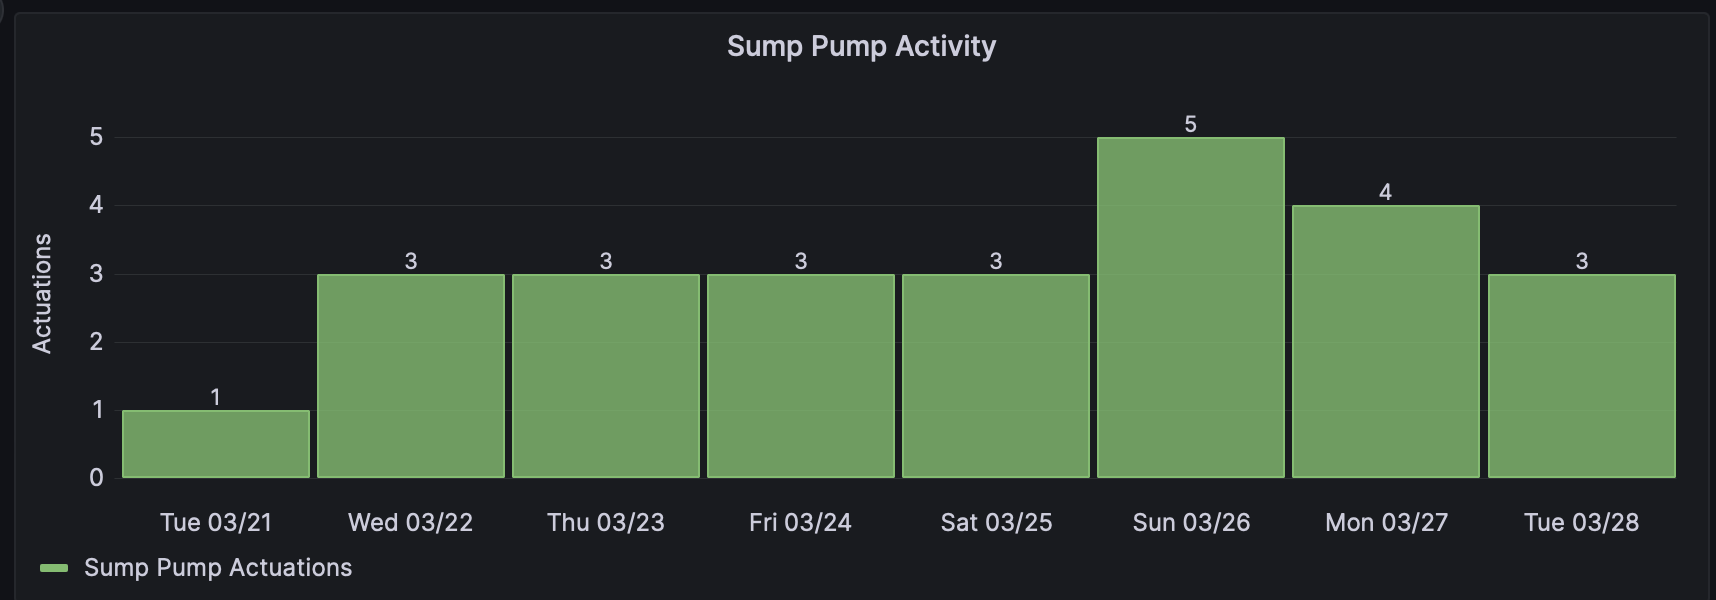
I finally got my reporting as I wanted in Grafana. Going back to my comment on your ZEN15 driver thread, I'm using 'accessory' state to count actuation and both 'off's and 'on's are over reported. (I think it has something to do with power reports.) So I can't just count the number of 'on's.
I'm not either an InfluxQL or Flux query writer, so it took some poking around. I first tried ChatGPT 3.5 and it was mediocre, never making progress and flipping back and forth between errors. I decided to pay for a month of ChatGPT 4 and it made a big difference. I still had to find some stuff via web search, but I got there. The most important thing it identified is a Flux function 'stateDuration' that is set to 0 when the value first becomes changes to the tracked level. Then I could filter to all the 0 (on) records. It took some digging. At first it thought the filter should be 1 instead of 0. Then it didn't know how to automatically adjust for time zones, so I had to do some searching for that. One important thing is that it identified that the query is much simpler in Flux than InfluxQL.
Thanks for the inspiration!
Can you share a ss on how to create the Grafana chart?
At the end of the day it's not a particularly complex Flux query, but I wouldn't have been able to do it by myself.
import "timezone"
option location = timezone.location(name: "America/Chicago")

from(bucket: "Hubitat_Influx")
  |> range(start: v.timeRangeStart, stop: v.timeRangeStop)
  |> filter(fn: (r) => r["_measurement"] == "accessory" and r["_field"] == "value")
  |> filter(fn: (r) => r["deviceName"] == "Power - Sump Pump")
  |> stateDuration(fn: (r) => r._value == "on", unit: 100ms, column: "state_duration")
  |> filter(fn: (r) => r.state_duration == 0)
  |> aggregateWindow(every: 1d, fn: count, createEmpty: false, timeSrc: "_start")
The most non-obvious thing is how to format the X axis. It's a multi-step process to add an override (at the bottom of the right side formatting panel):
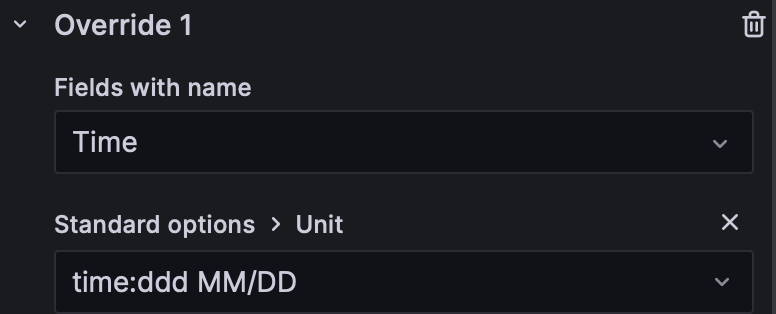
1 Like
Thanks, I never did figure out how to do the timezone thing, I was using some hack to subtract the hours and it would then be off when DST changed. Also did not know how format the time properly!
I am not totally sure what that stateDuartion thing does, possibly helps with your duplicated events. I was able to make it work with just this:
import "timezone"
option location = timezone.location(name: "America/Chicago")

from(bucket: "hubitat_events")
  |> range(start: v.timeRangeStart, stop: v.timeRangeStop)
  |> filter(fn: (r) => r["_measurement"] == "switch" and r["_field"] == "value")
  |> filter(fn: (r) => r["displayName"] == "Sump Pump")
  |> filter(fn: (r) => r._value == "on")
  |> aggregateWindow(every: 1d, fn: count, createEmpty: false, timeSrc: "_start")
Yes, GPT 4 was suggesting what I imagine your add/subtract logic is/was. And it never made sense to me. It's funny how when you find something wrong GPT apologizes, acknowledges its error, and will try again. Sometimes its follow-up is wrong too. I figured the timezone thing with a DuckDuckGo query.
That's exactly what it does. I get 3 'on's for every actual event. An alternative that I didn't try lies in the Hubitat Influx logger app. I think there is an option to only send changed values.
Updated my top post with the Flux query and an updated screenshot since I added some sexy rounded edges to the bars. 
2 Likes
Thank you for posting this. You inspired me to setup Influx and Grafana to plot my sump pump activity. Everything is working great. Also, thanks to @bill.d for the Flux query info. I didn't like the way the first bar in the chart only showed a partial days usage, so I added the following to the end of the flux query:
|> group()
|> tail(n: 7)
This removes the first bar.
1 Like

