I've been looking around to see if there’s an app within Hubitat that I can use to monitor my smart plugs over a period of time.
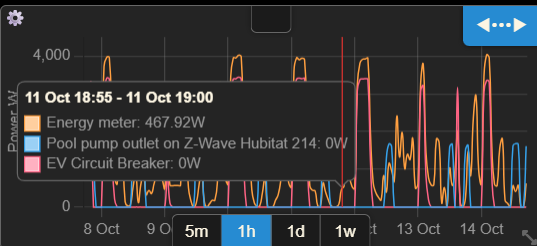
And get a graphical overview showing peak hours, watt levels, and when usage is low, etc.
I have one plug connected to my server, and I can see its current power usage at this moment, but I’d like to view usage data over a longer period or within a specific timeframe that I choose.
Maybe there are add-ons for this, but I haven’t been able to find any so far. Thanks in advance for any tips.