We’re excited to announce the release of a brand-new dashboard feature that allows you to visualize your data at a glance! With this update, you can now see basic graphical representations of your information, making it easier to track trends, monitor sensor data, and make informed decisions.
Key highlights:
- Clear, easy-to-read graphs and charts
- Quick access to essential metrics
- Enhanced data visualization for better insights
This is just the beginning — we’ll continue improving and expanding the dashboard to provide even more powerful tools. Explore the new feature today by selecting the new Easy Dashboard graph tile and see your data come to life!
New tile settings:
#
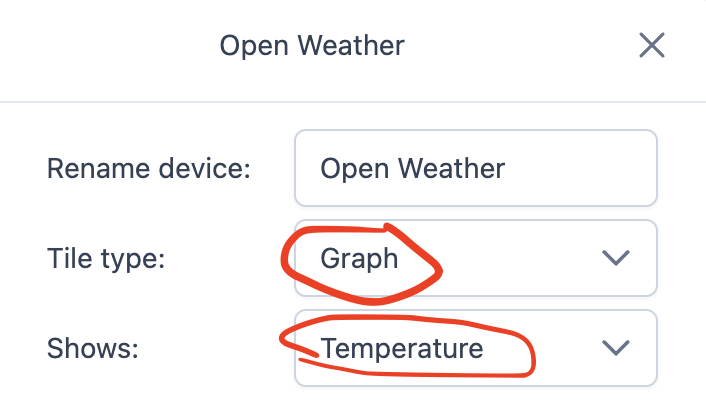
Graphical representation:


