HPM picked it up this time. 
Big numbers?
Reponse Time
10349
1 Like
It is in ms so 1000= 1 second so that is 10 seconds and 349 ms.
That should of generated a log message as well in your live logging. Something like the below

the number in red is the time it takes for it to go from the hub and get back from Govee. The second value is that time + the time it takes to parse and process the response. so in my example above it took 13025ms to send the call to Govee and get a response. It took a total of 13031 for the entire command to be processed. So it to 6ms for the hub to process the response.
Since about 11:30 i have seen a elevated number of high transaction times occuring.
I have reactivated my Influxdb/Grafana cloud account just for Govee status. You can look at the link below to see the current stats collected. If anyone else wants to contribute their api results let me know i will create a token for you and give you directions on how to add your stats.
https://mavrrick58.grafana.net/public-dashboards/d1ea294188e8418aaccf2cbd0be6db58
Just having a look and inundated with errors starting at 10:00 PST, -7.
Looks like something you could trap, due to long timeouts?

Sorry. That is my fault. I didn't have the Govee Device Manager flagged to be upgraded when i published the update. I have updated the Beta version number so it should trigger a update, or you can just do a HPM Repair to ensure you get all the latest code.
Sorry about that.
Hey, all good. Without your time and effort we would have nada. 
1 Like
I'd be happy to contribute.
Quick question.
As I have a rather permanent slow down I get lots of these logs.
I have tried different logging levels but these always come though.
Are they part of the logging code or just there for some quick info until the delay from Govee gets sorted?

Well the intent was to tell you whenever a delay over 10 seconds occured. So your statement about them being quick info until Govee gets it sorted is spot on. That said I didn't expect this to take this long to get resolved.
If you turned on debug logging you would get a similar message for every cloud API Call reguardless of transaction time. I have adjusted the messaging a little bit in my local code so i can see if they are device status lookups, Commands, Scene data retrievel, ect. That was mostly out of curiousity though.
Thanks for the info.
I was rocking 10s for quite a while and now it's 20-30.
Yea.. Things are not going the right direction. You can look at the link I provided above and see the trending since i reactivated my Influx/Grafana cloud stack. I am seeing the same upward trends as well.
I have two support cases open with Govee currently and have actually provided them the URL for my simple dashboard on the Influxdb/Grafana cloud stack above as well. I have a feeling they are working on it and just trying to find cause.
I feel like they clearly have some kind of memory leak or something that builds over time. There was a similar issue a little before last christmas. That is what triggered the addition of the api response time message and a 60 second timeout setting being added.
Getting any company to actually Ack an issue and work with you is the best possible outcome.
Wow, just got about 1k of these on the rec room lights activator which controls the 4 Govee lights I have in about 2 hours.
Rebooting now to see if it runs away.

Probably a false positive because of how cpu load is calculated on linux. It includes wait states which govee Cloud devices will have allot of right now. Tcp wait states don't block the cpu from doing other tasks though
@mavrrick58, could I trouble you to add support for a new device? I just installed the new Govee ceiling fan (H1310). It's pulling in with the color lights 3 driver, but that doesn't allow for control of the fan or toggling the top and bottom portions of the light separately. This is the device data from the device info tab for it.
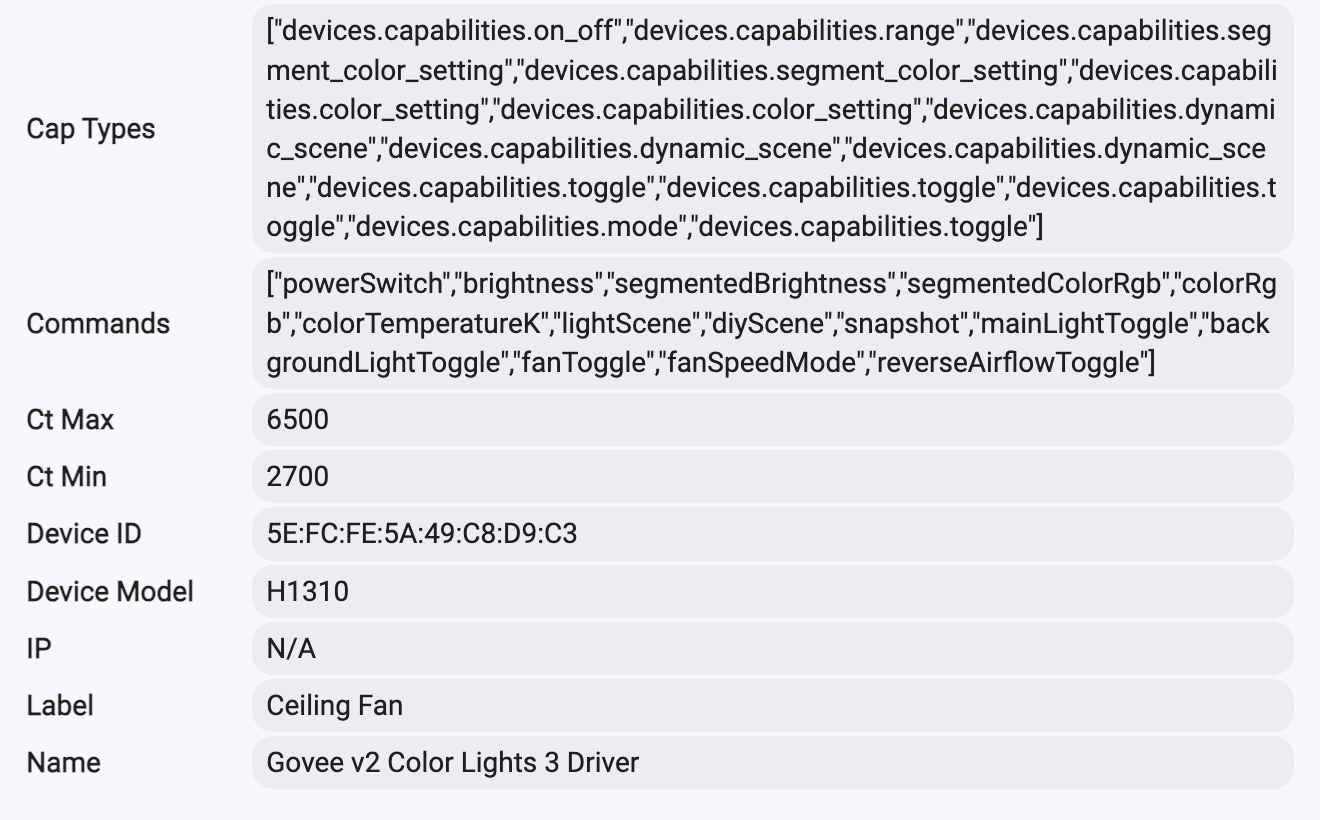
I'm happy to do whatever I can to help.
Thanks so much!
1 Like
I purchased one of these devices on release with the initial release discount code. I just haven't installed it yet. Honestly the slow Cloud API response times discussed so much above hasn't helped.
It has a fair amount of stuff to unpack actually. It looks like it may support all three management options: Lan, Cloud, and MATTER. Am i wrong in that assumption. If you go into the device settings do you see an option to enable LAN control? It clearly supports at least Cloud and Matter though based on packaging.
I will need to think about the best way to manage the parts of the device. In many cases fan devices on Hubitat uses child component devices.
Is there a limit to how the parts of the device can be turned on. I would hope not, but the Uplighter lamp can only have two of the 3 light sources on at a given time. I love the lamp, but that makes it a bit harder to manage. It makes that device more dependent on scenes to change what is active then i would like.
It is interesting that this is pulling in and using the Govee v2 Color Lights 3 Driver. That means Govee is categorizing it as a light device instead of fan in the Govee API Device response details call.
Okay, well with all that said what are we going to do about it. I think first i need to get mine installed so i can properly test while working on the driver. The good news is all of the parts are figured out, it is just a matter of combining the parts into a single driver, or single set of Parent/Child drivers. Also once installed i will probably work on getting a matter driver built. Considering the issues with the Cloud response times recently that may be the preferred method to connect it to Hubitat. Again i worked allot on a few matter fan drivers so this is more about working out the kinks for Govee instead of starting from scratch. Last check out the whole LAN control/API idea to see if there is any chance of that helping.
This will likely take a little while so please be patient. Once i get something i will start posting it to my beta code so you can at least start to test it.
I got mine with the initial discount code, too.  It had been sitting in the box for about a week, but I finally got a chance to get it up yesterday. It's a busy time of year, plus had to swap out the box for a fan rated one.
The app allows controlling the top light (including separate segments), the bottom light, and the fan. Based on the commands listed, it looks like the API supports controlling all of that, too.
It does support lan control. I haven't used that at all yet. I've been meaning to move my devices that support it to the lan control for better performance, but haven't gotten around to it yet.
I can be patient. I'm also happy to help test or whatever else I can do. Super excited to get this thing fully integrated. Thanks so much for your help and all of your work on this integration!
1 Like
Just an FYI for the rare few that might be suffering from the slow-down and running WebCore to control their lights.
I got many thousands of these warnings again yesterday and it turned out the WC piston was basically in a loop trying to establish a lighting condition, getting no feedback and trying again and again.
I disabled the piston and all is quiet.
I'm currently at about 15-25 seconds of delay.
Quick update on my response time issue with the Govee cloud API.
I submitted a support ticket to Govee eight days ago. My logs show the CloudAPI response time ranges from 150 ms to 15 sec. Sometimes as much as 2 minutes. LAN devices work fine. Govee app works fine. I asked Govee support for an update on my ticket three times over the past week. Every time, they reply with "our relevant team is actively investigating the issue. As of now, no resolution.