I’ve been trying to figure this out for some time. Is there an easy way to see a compiled list of all device events in chronological order? Wink had a really easy way to see this.
Other than looking at the LOGS entry on the web UI, no. Not standard anyway (you could of course roll your own with external databases/dashboards, etc).
Crap ok. I saw this but isn’t nearly as clean as wink.
Yeah, theirs was nice. Home Assistant has a nice one too.
Maybe Hubitat will add one in the future - don't know.
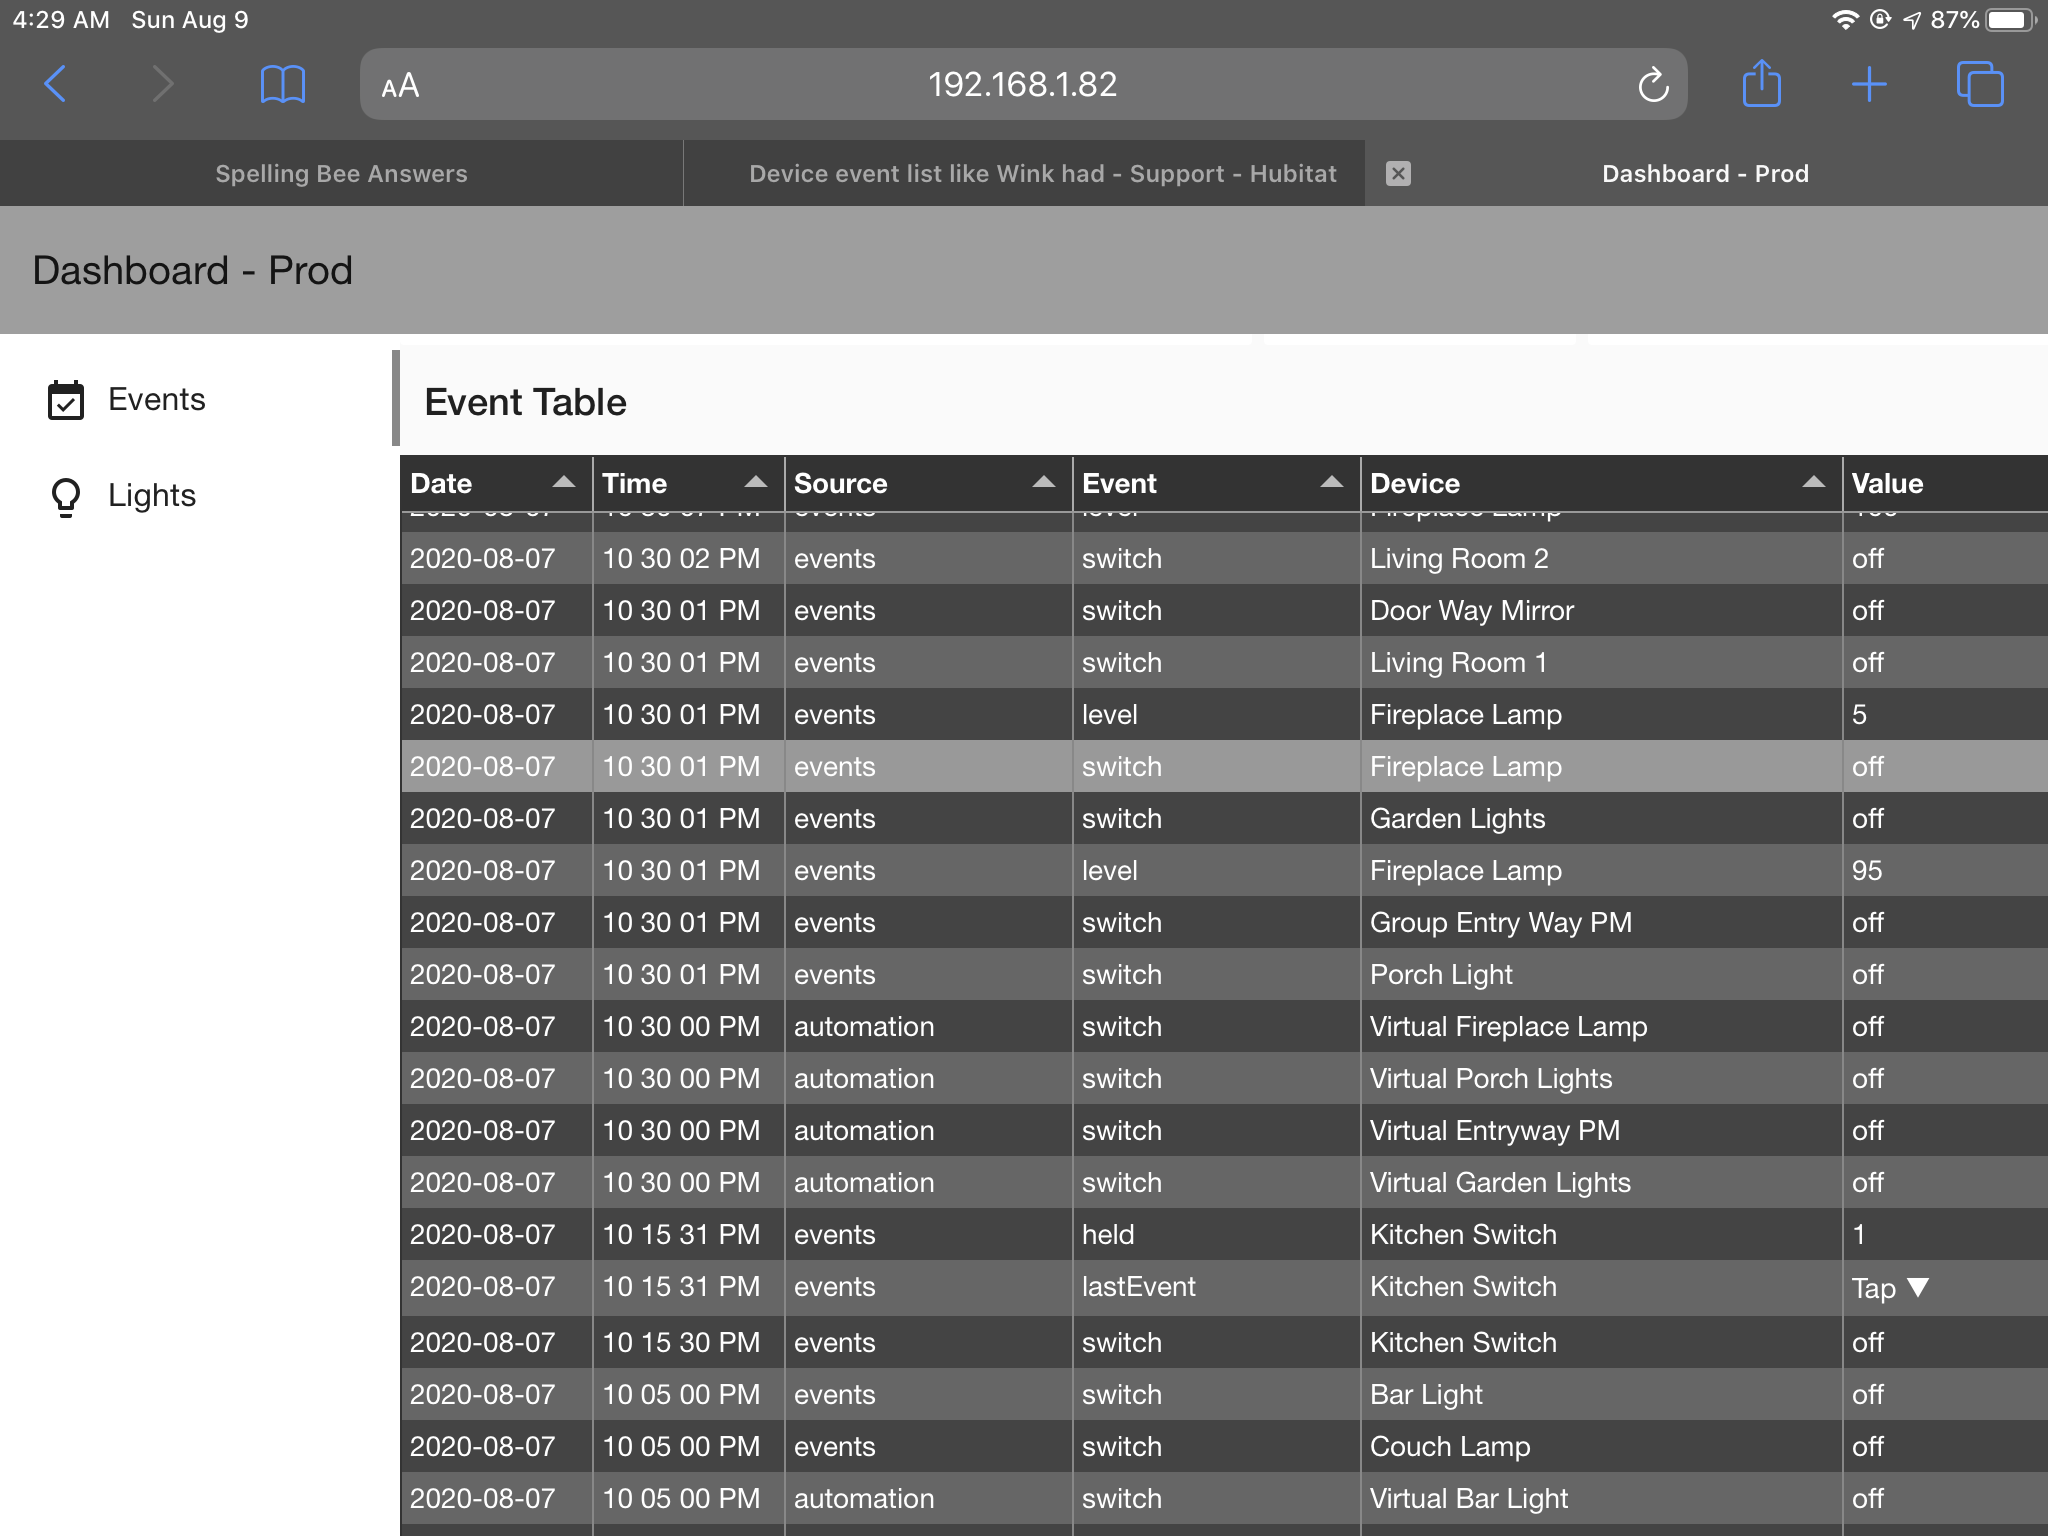
I came from Wink and missed the “event” list too. So like @JasonJoel said, I rolled my own using Nodered and MySQL using MakerAPI to publish events. I had to use some workarounds to log which rule (app) generated the event, but it is working. Had to learn Nodered, and do a lot of trial and error ![]() , but this is what it looks like:
, but this is what it looks like:
Would be glad to share the flows if you want.
1 Like
That is incredible! I’d love a how-to with this!
Give me a couple of days and I'll put together something. The starting point was this thread
Hubitat>Nodered>MySql>Grafana (LONG READ).
My approach to logging events was based on @corerootedxb's excellent thread (linked above). Hence I will skip steps that are redundant and will just refer to his posts. The primary difference between what was written in that thread and what I did is that I use Node-RED dashboard to display the events and not Grafana. Also, since MakerAPI does not publish information on which automation triggered the event, I use virtual switches to track automations (and follow a naming convention of "Virtual+name of automation").
Hardware:
Node-RED server - Raspberry Pi4 (also running Homebridge)
MySQL database server - 2011 MacBook Pro
Software:
MySQL Community edition (MySQL :: Download MySQL Community Server)
SQL Editor (DBVisualizer - https://www.dbvis.com). Note: This is just a personal preference as I have used this tool for years.
Node-RED (https://nodered.org) Note: I installed this on the Mac (for testing) and on the Pi using the tool that comes with the pre-configured version of Homebridge
Node-RED nodes (plug-ins - installed using the palette manager):
- node-red-contrib-deduplicate (suppress duplicates)
- node-red-contrib-hubitat (subscribe to Hubitat Maker API)
- node-red-contrib-moment (formatting dates)
- node-red-dashboard (display the events page and much more)
- node-red-node-mysql (connect to MySQL database)
- node-red-node-ui-table (this displays the events on the dashboard)
Setting up the core components:
I followed the steps in original post linked above ( See: How do I set it all up?). I did not install Grafana.
To create the SQL tables, I used the script https://raw.githubusercontent.com/code-in-progress/Hubitat/master/Node-Red/flows/database_setup.sql . However, given that I only use the "Events" table, I could have used the script to create just the events table (Hubitat/events-table.sql at master · code-in-progress/Hubitat · GitHub). Since I was eventually going to be running the database and Node-RED on separate servers, I followed @corerootedxb's advice ("If you are running NodeRed and MySQL on separate servers, you'll need to change the @'localhost' to match your environment "). This is used in the configuration of the MySQL nodes, so it's better to start off this way (even though originally my DB and Node-RED were on the same machine).
Configuring Hubitat:
For Node-RED
Follow this Node-RED nodes for hubitat for configuring the Hubitat Configuration node in Node-RED and also MakerAPI in Hubitat. I have multiple child instances of the MakerAPI app (for Homebridge, Node-RED live, Node-RED test) and it all works. If you have different instances of Node-RED (test/prod), you have to remember to change the MakerAPI parameters.
For identifying automations:
I created virtual switches based on each automation. All virtual switches begin with "Virtual + identifying name of automation" (e.g Virtual Entryway PM). This switch (along with the lights) is turned on by a Simple Automation Rule and is turned off by another rule (along with the lights). These virtual switches are exposed through MakerAPI to Node-RED and used in the flows to log when an automation ran.
Node-RED Flows
Log Hubitat events to database:
Basic flow -
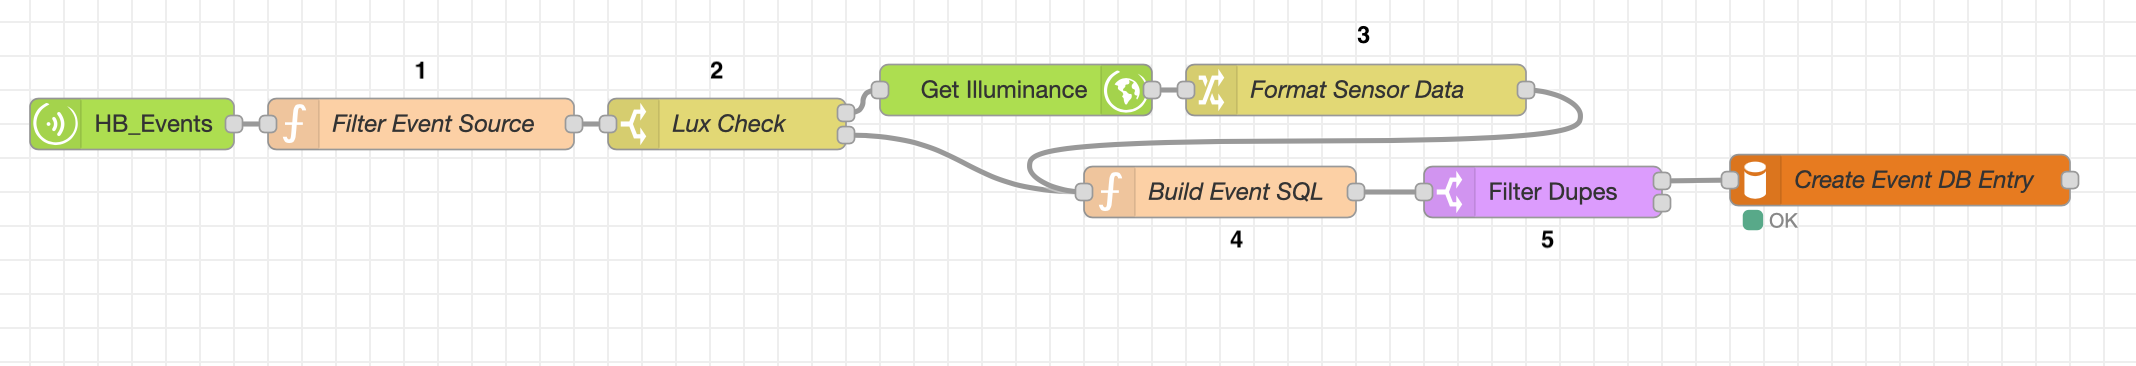
1. Filter Event Source - this is a function node that has logic to filter out events that I do not want to log (e.g. lux changes, power consumption etc.)
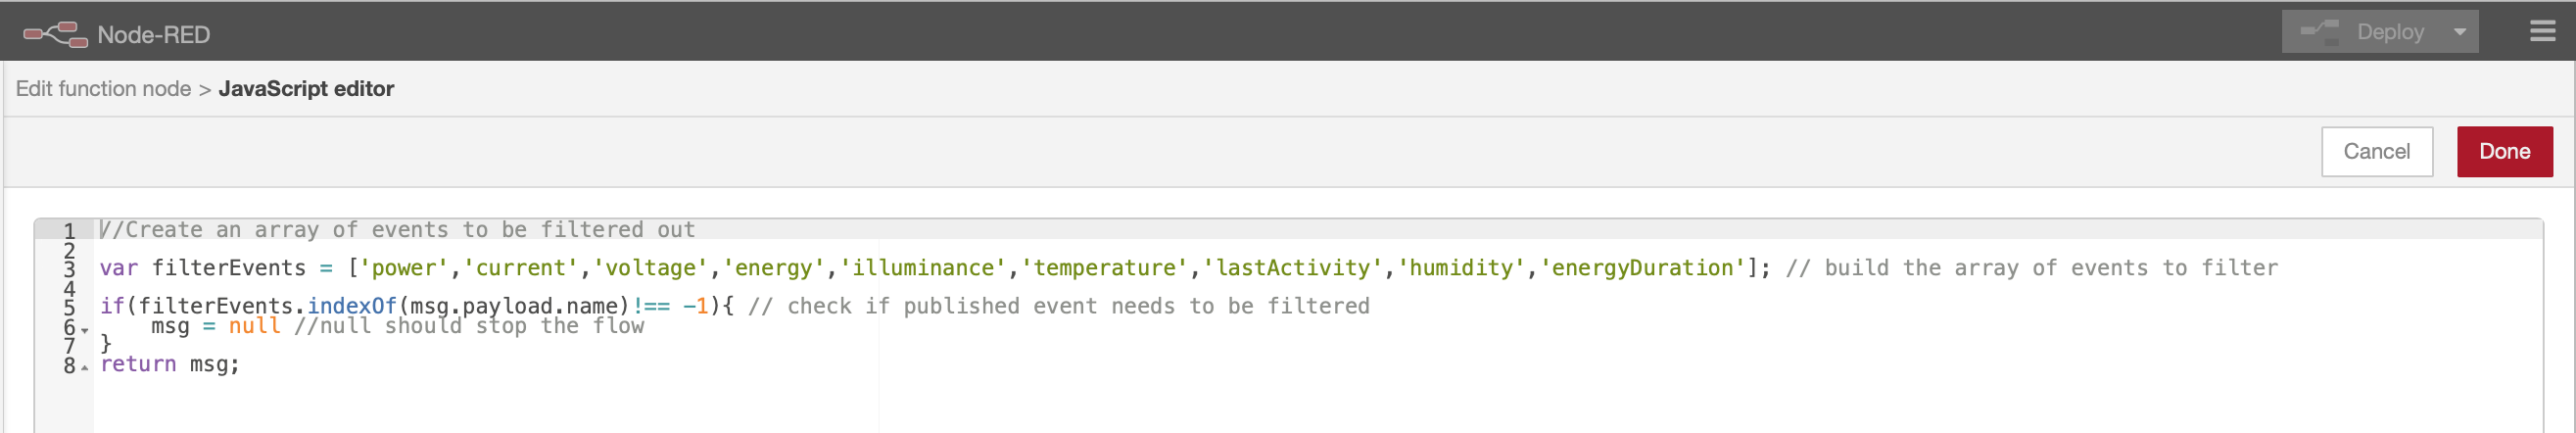
Function node filter events Javascript
//Create an array of events to be filtered out
var filterEvents = ['power','current','voltage','energy','illuminance','temperature','lastActivity','humidity','energyDuration']; // build the array of events to filter
if(filterEvents.indexOf(msg.payload.name)!== -1){ // check if published event needs to be filtered
msg = null //null should stop the flow
}
return msg;
2. Lux Check - this switch node determines if the event was generated by the lux sensor (illuminance changes are filtered out as they were flooding the database, but the virtual switch Virtual Bookcase Lux gets turned on if the lux level falls below a threshold).

If it is lux event, then the flow queries the current lux reading from the sensor.
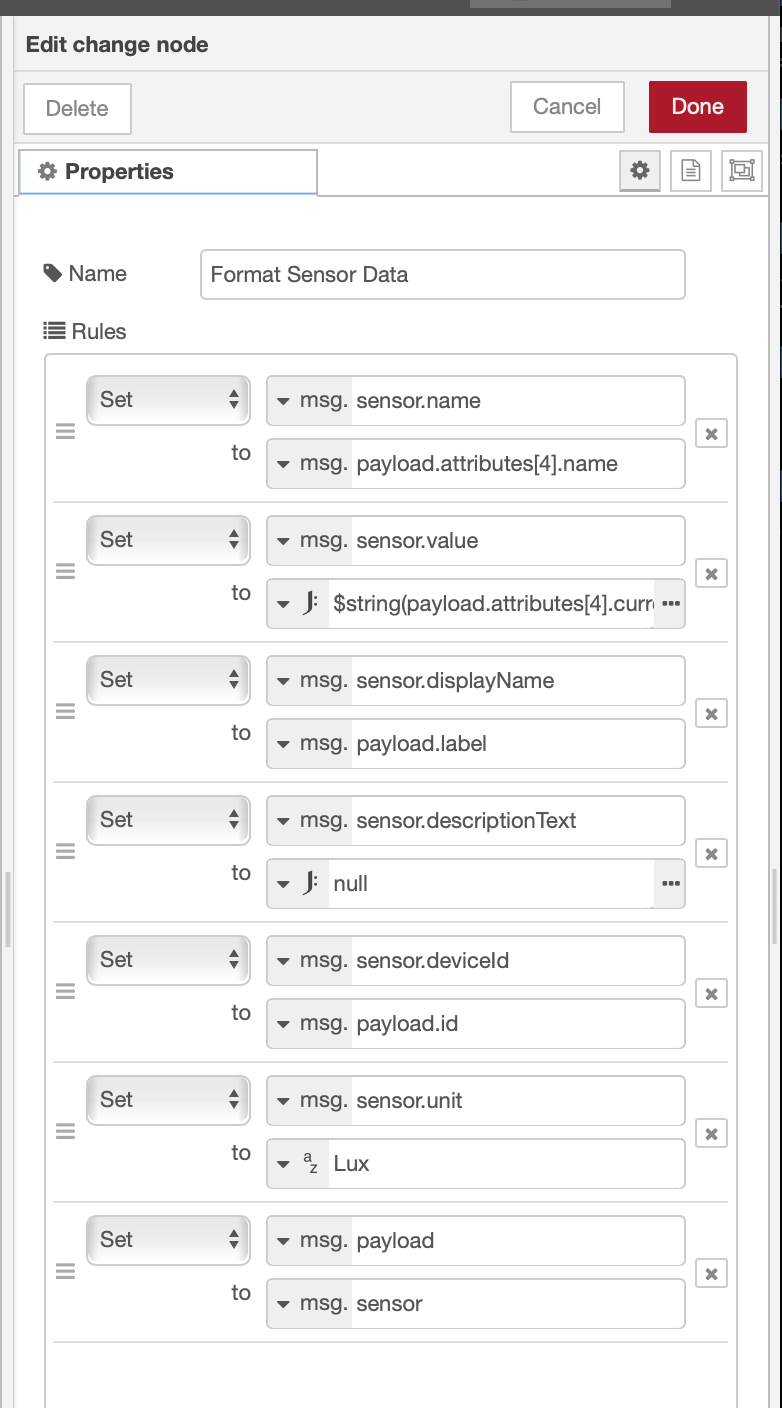
3. Format Sensor Data - A change node formats the lux reading so that it conforms to the structure of the events published by Hubitat
4. Build the SQL statement for inserting event data - based almost entirely on the javascript contained in the original but slight mods to identify "automation" vs "event".
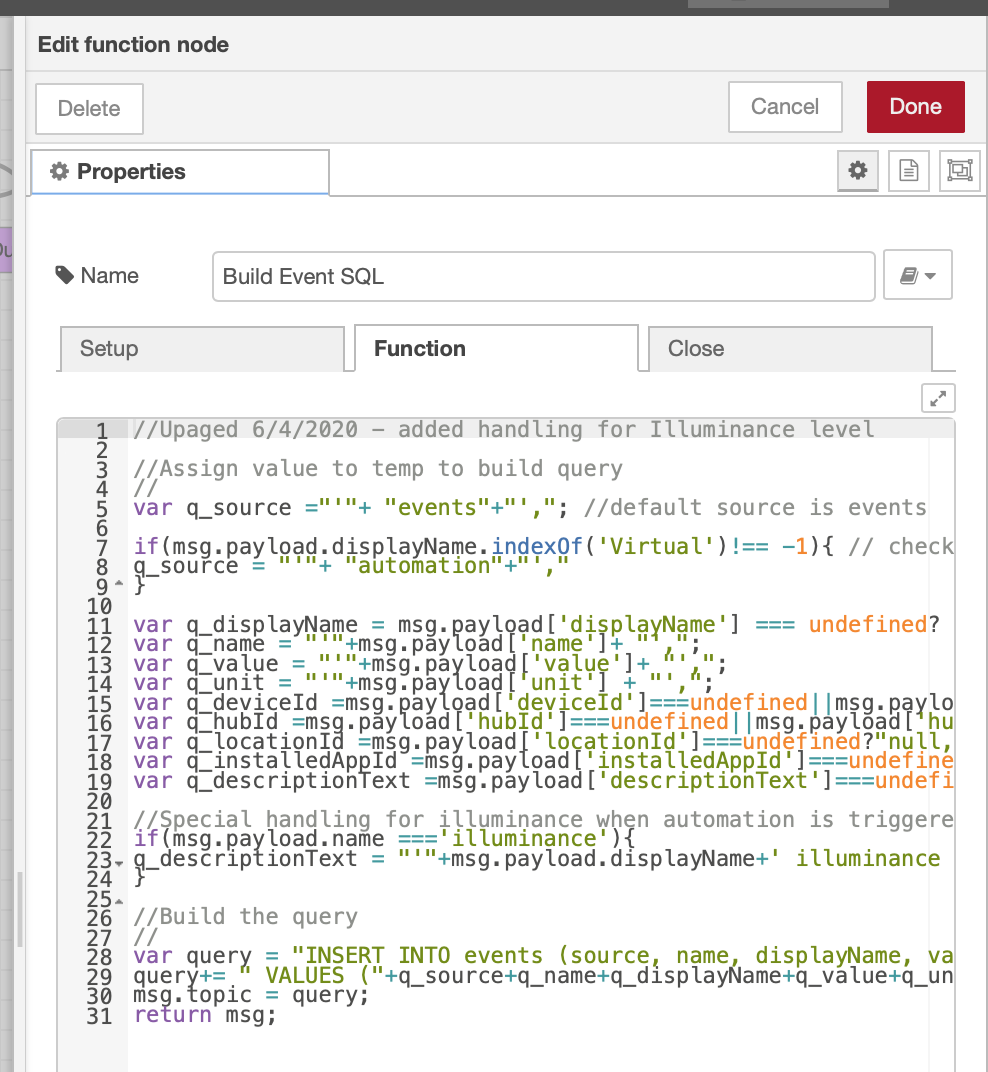
Function node build SQL statement Javascript"
//Upaged 6/4/2020 - added handling for Illuminance level
//Assign value to temp to build query
//
var q_source ="'"+ "events"+"',"; //default source is events
if(msg.payload.displayName.indexOf('Virtual')!== -1){ // check if this is an automation (requires virtual device with name "Virual...")
q_source = "'"+ "automation"+"',"
}
var q_displayName = msg.payload['displayName'] === undefined? "null,":"'"+msg.payload['displayName']+"',";
var q_name = "'"+msg.payload['name']+ "',";
var q_value = "'"+msg.payload['value']+ "',";
var q_unit = "'"+msg.payload['unit'] + "',";
var q_deviceId =msg.payload['deviceId']===undefined||msg.payload['deviceId']===null?"null,": "'"+msg.payload['deviceId']+"',";
var q_hubId =msg.payload['hubId']===undefined||msg.payload['hubId']===null?"null,": "'"+msg.payload['hubId']+"',";
var q_locationId =msg.payload['locationId']===undefined?"null,": "'"+msg.payload['locationId']+"',";
var q_installedAppId =msg.payload['installedAppId']===undefined?"null,":"'"+msg.payload['installedAppId']+"',";
var q_descriptionText =msg.payload['descriptionText']===undefined?"null":"'"+msg.payload['descriptionText']+"'";
//Special handling for illuminance when automation is triggered by lux
if(msg.payload.name ==='illuminance'){
q_descriptionText = "'"+msg.payload.displayName+' illuminance is '+msg.payload.value+' Lux'+"'"
}
//Build the query
//
var query = "INSERT INTO events (source, name, displayName, value, unit, deviceId, hubId, locationId, installedAppId, descriptionText)";
query+= " VALUES ("+q_source+q_name+q_displayName+q_value+q_unit+q_deviceId+q_hubId+q_locationId+q_installedAppId+q_descriptionText+")";
msg.topic = query;
return msg;
5. Filter Dupes - The deduplicate node filters out duplicate events. For some reason, I was getting duplicate database entries so I put this in to prevent that.
Dashboard flow to display logged events:
Basic flow -

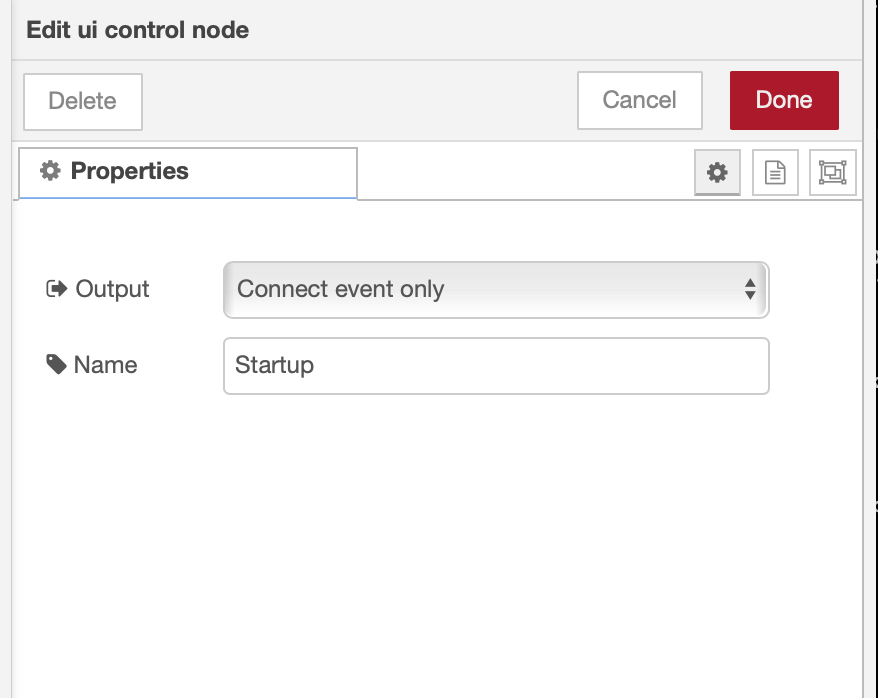
1. Startup - This control node executes the flow on startup - otherwise it would just show a blank page
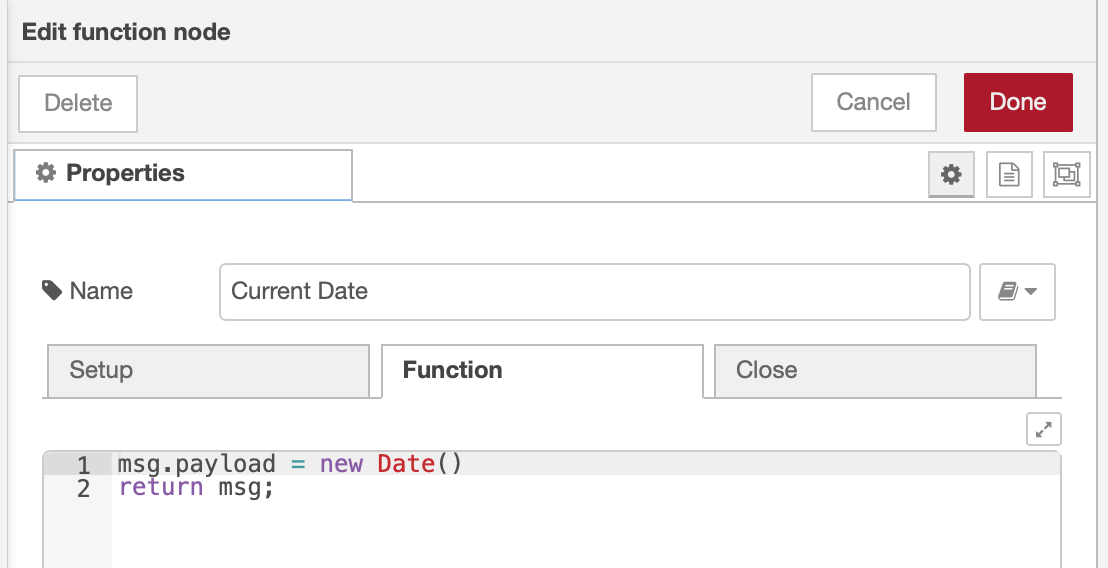
2. Current date - this function node is used to get the current date which is then used in the database query to fetch the events for that date
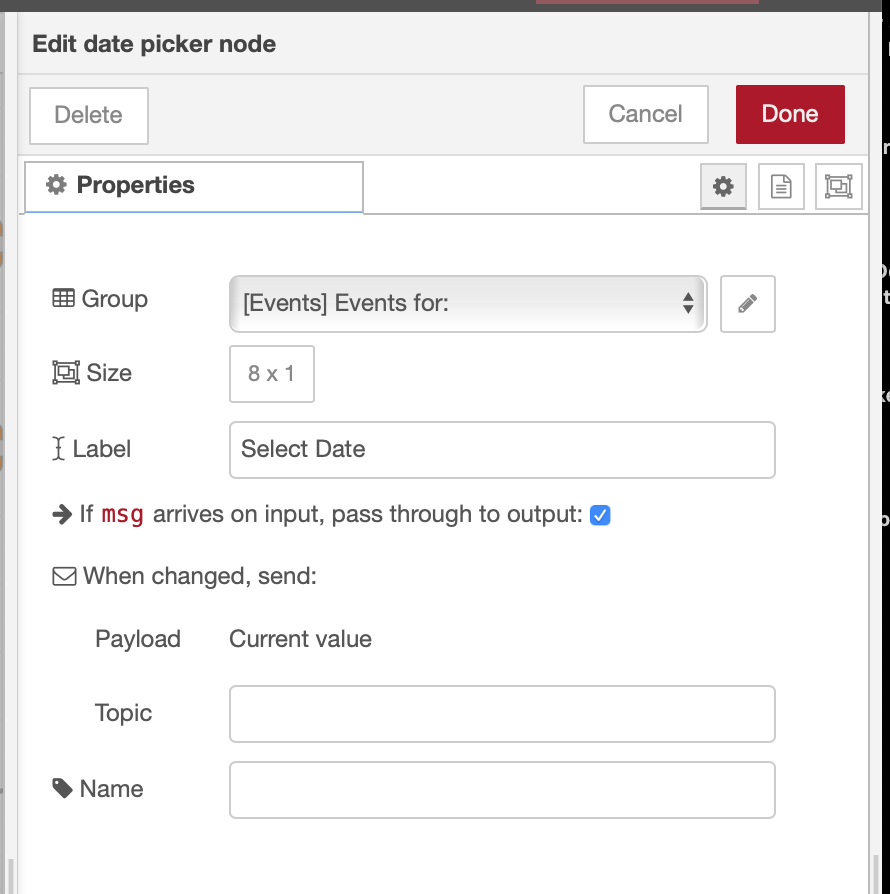
3. Select date - The date picker node allows the user to select a date and have the events for that shown. At startup, it defaults to the current date (from the previous step).
4. Format date- the moment node (uses the moment javascript library) formats the date to the current timezone since javascript dates default to UTC time

5. Event Count SQL - the function node gets the total count of events for the selected date
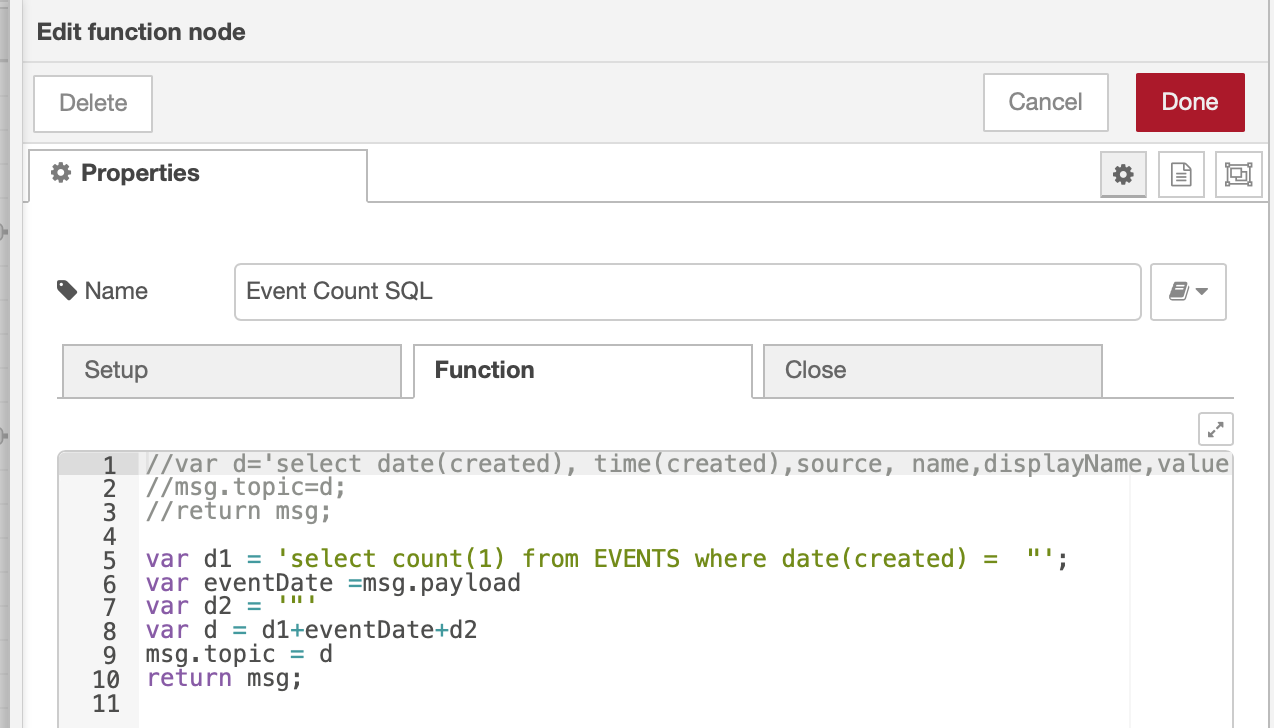
Function node get events count SQL javascript
//var d='select date(created), time(created),source, name,displayName,value, deviceId,unit from EVENTS where date(created)=current_date() order by row_id desc'
//msg.topic=d;
//return msg;
var d1 = 'select count(1) from EVENTS where date(created) = "';
var eventDate =msg.payload
var d2 = '"'
var d = d1+eventDate+d2
msg.topic = d
return msg;
6. Convert array to string - this change node converts the results of the SQL query (always returns an array) to a string so that it can be displayed on the dashboard.

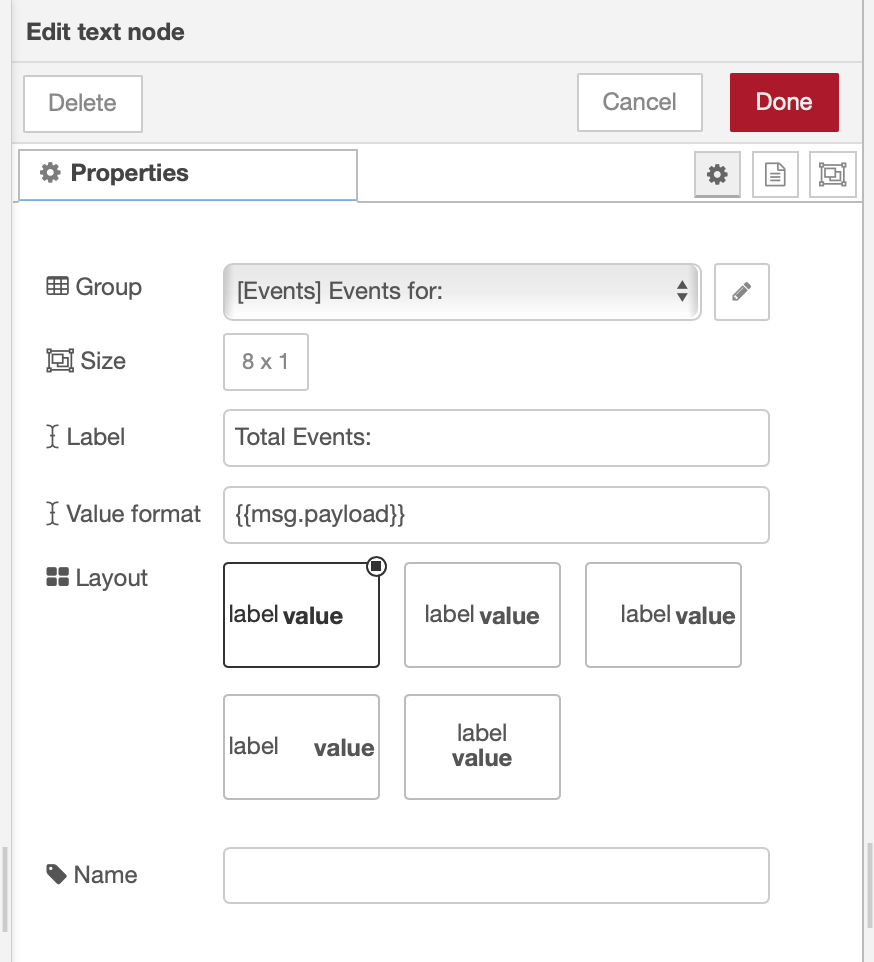
7. Total Events - uses a text node to show the total events for the selected date
8. Fetch event SQL - function node to build the SQL to get all events for the selected date
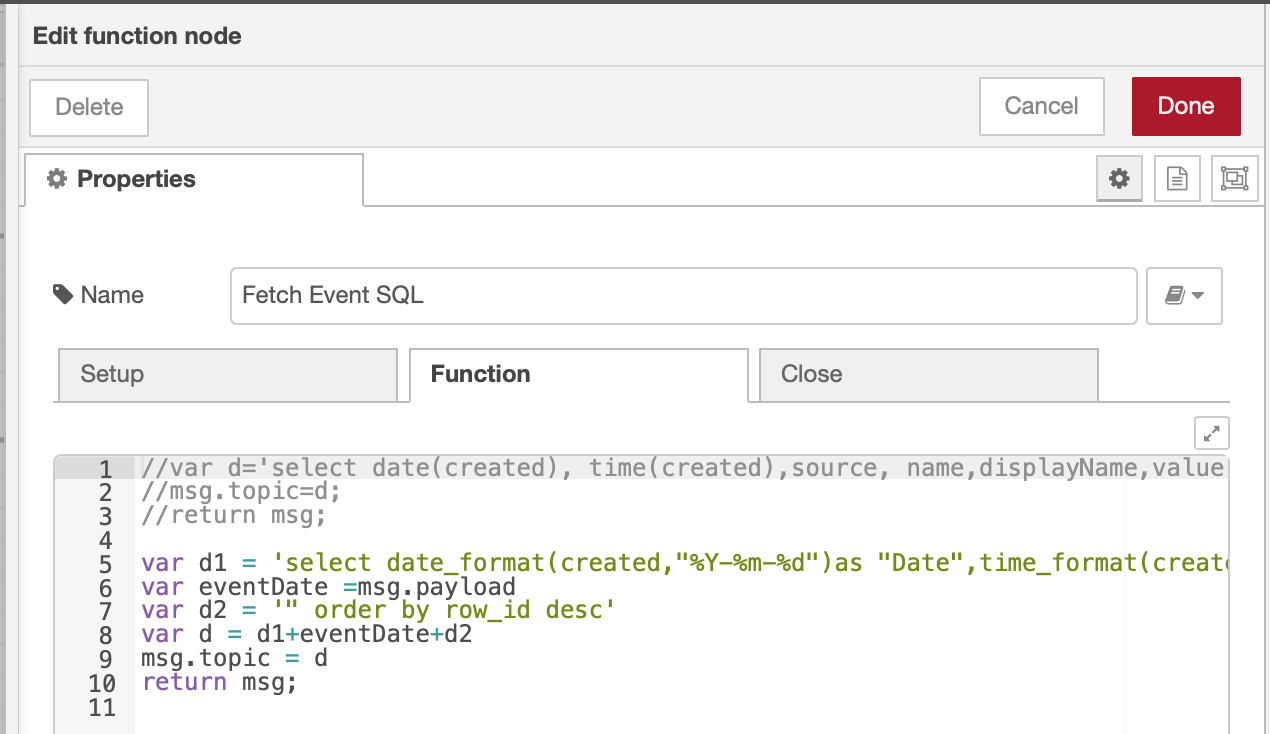
Javascript to build the SQL statement for getting events
//var d='select date(created), time(created),source, name,displayName,value, deviceId,unit from EVENTS where date(created)=current_date() order by row_id desc'
//msg.topic=d;
//return msg;
var d1 = 'select date_format(created,"%Y-%m-%d")as "Date",time_format(created,"%h %i %s %p") as "Time",source as "Source",name as "Event", displayName as "Device", value as "Value" from EVENTS where date(created) = "';
var eventDate =msg.payload
var d2 = '" order by row_id desc'
var d = d1+eventDate+d2
msg.topic = d
return msg;
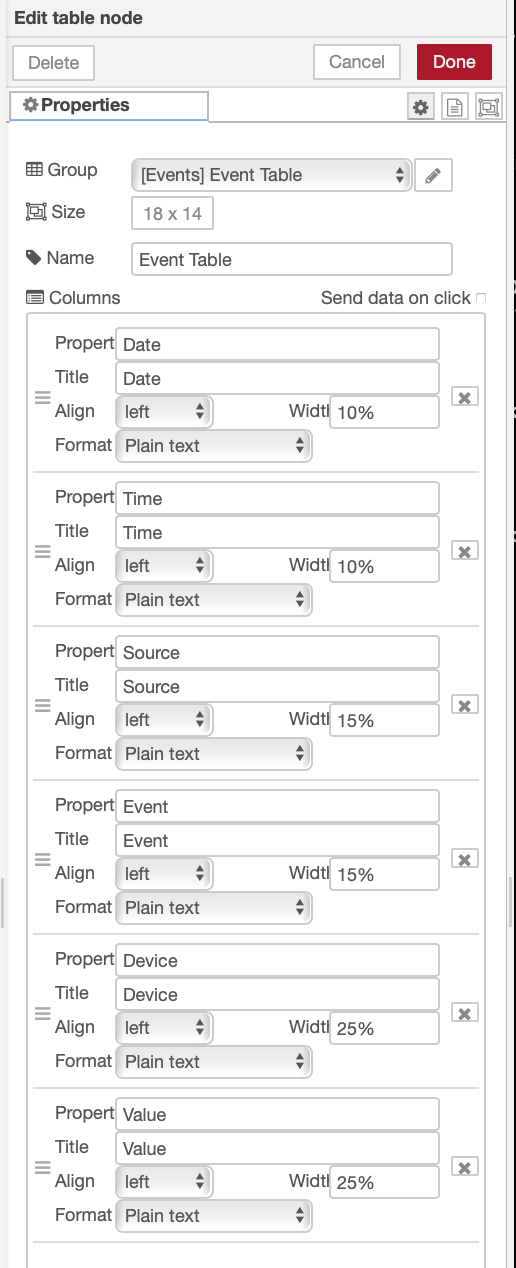
9. Map data to ui-table node - ui-table node is used to display the event data. The fields returned by the SQL statement are mapped here. I am not CSS literate so chose the simple way to do it. There is a whole thread over in the Node-RED forums (Examples for node-red-node-ui-table - Dashboard - Node-RED Forum) on how to use this but most of it was over my head 
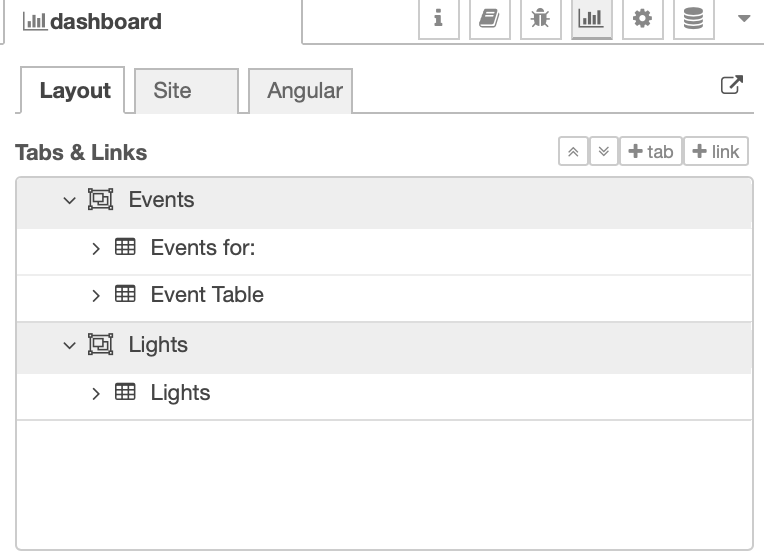
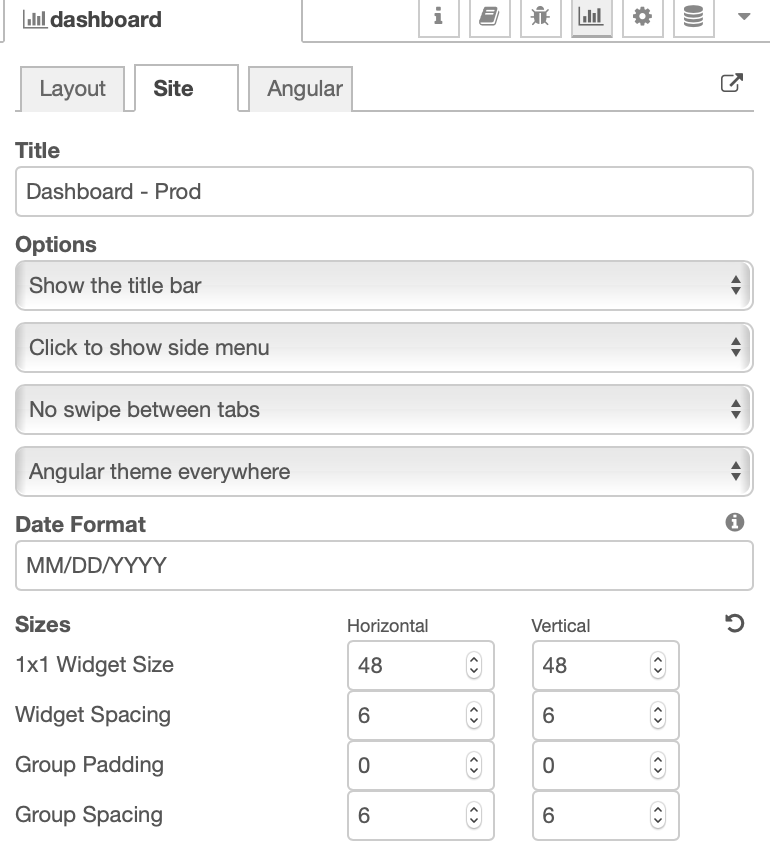
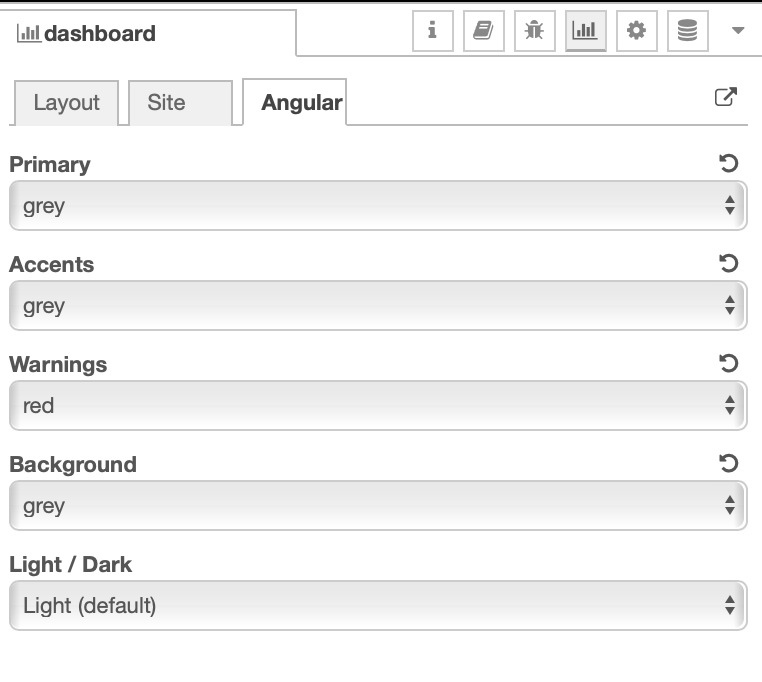
Node-RED dashboard configuration:
Some basic dashboard configuration (at least how I have mine configured)
Finally - here is what the end product looks like
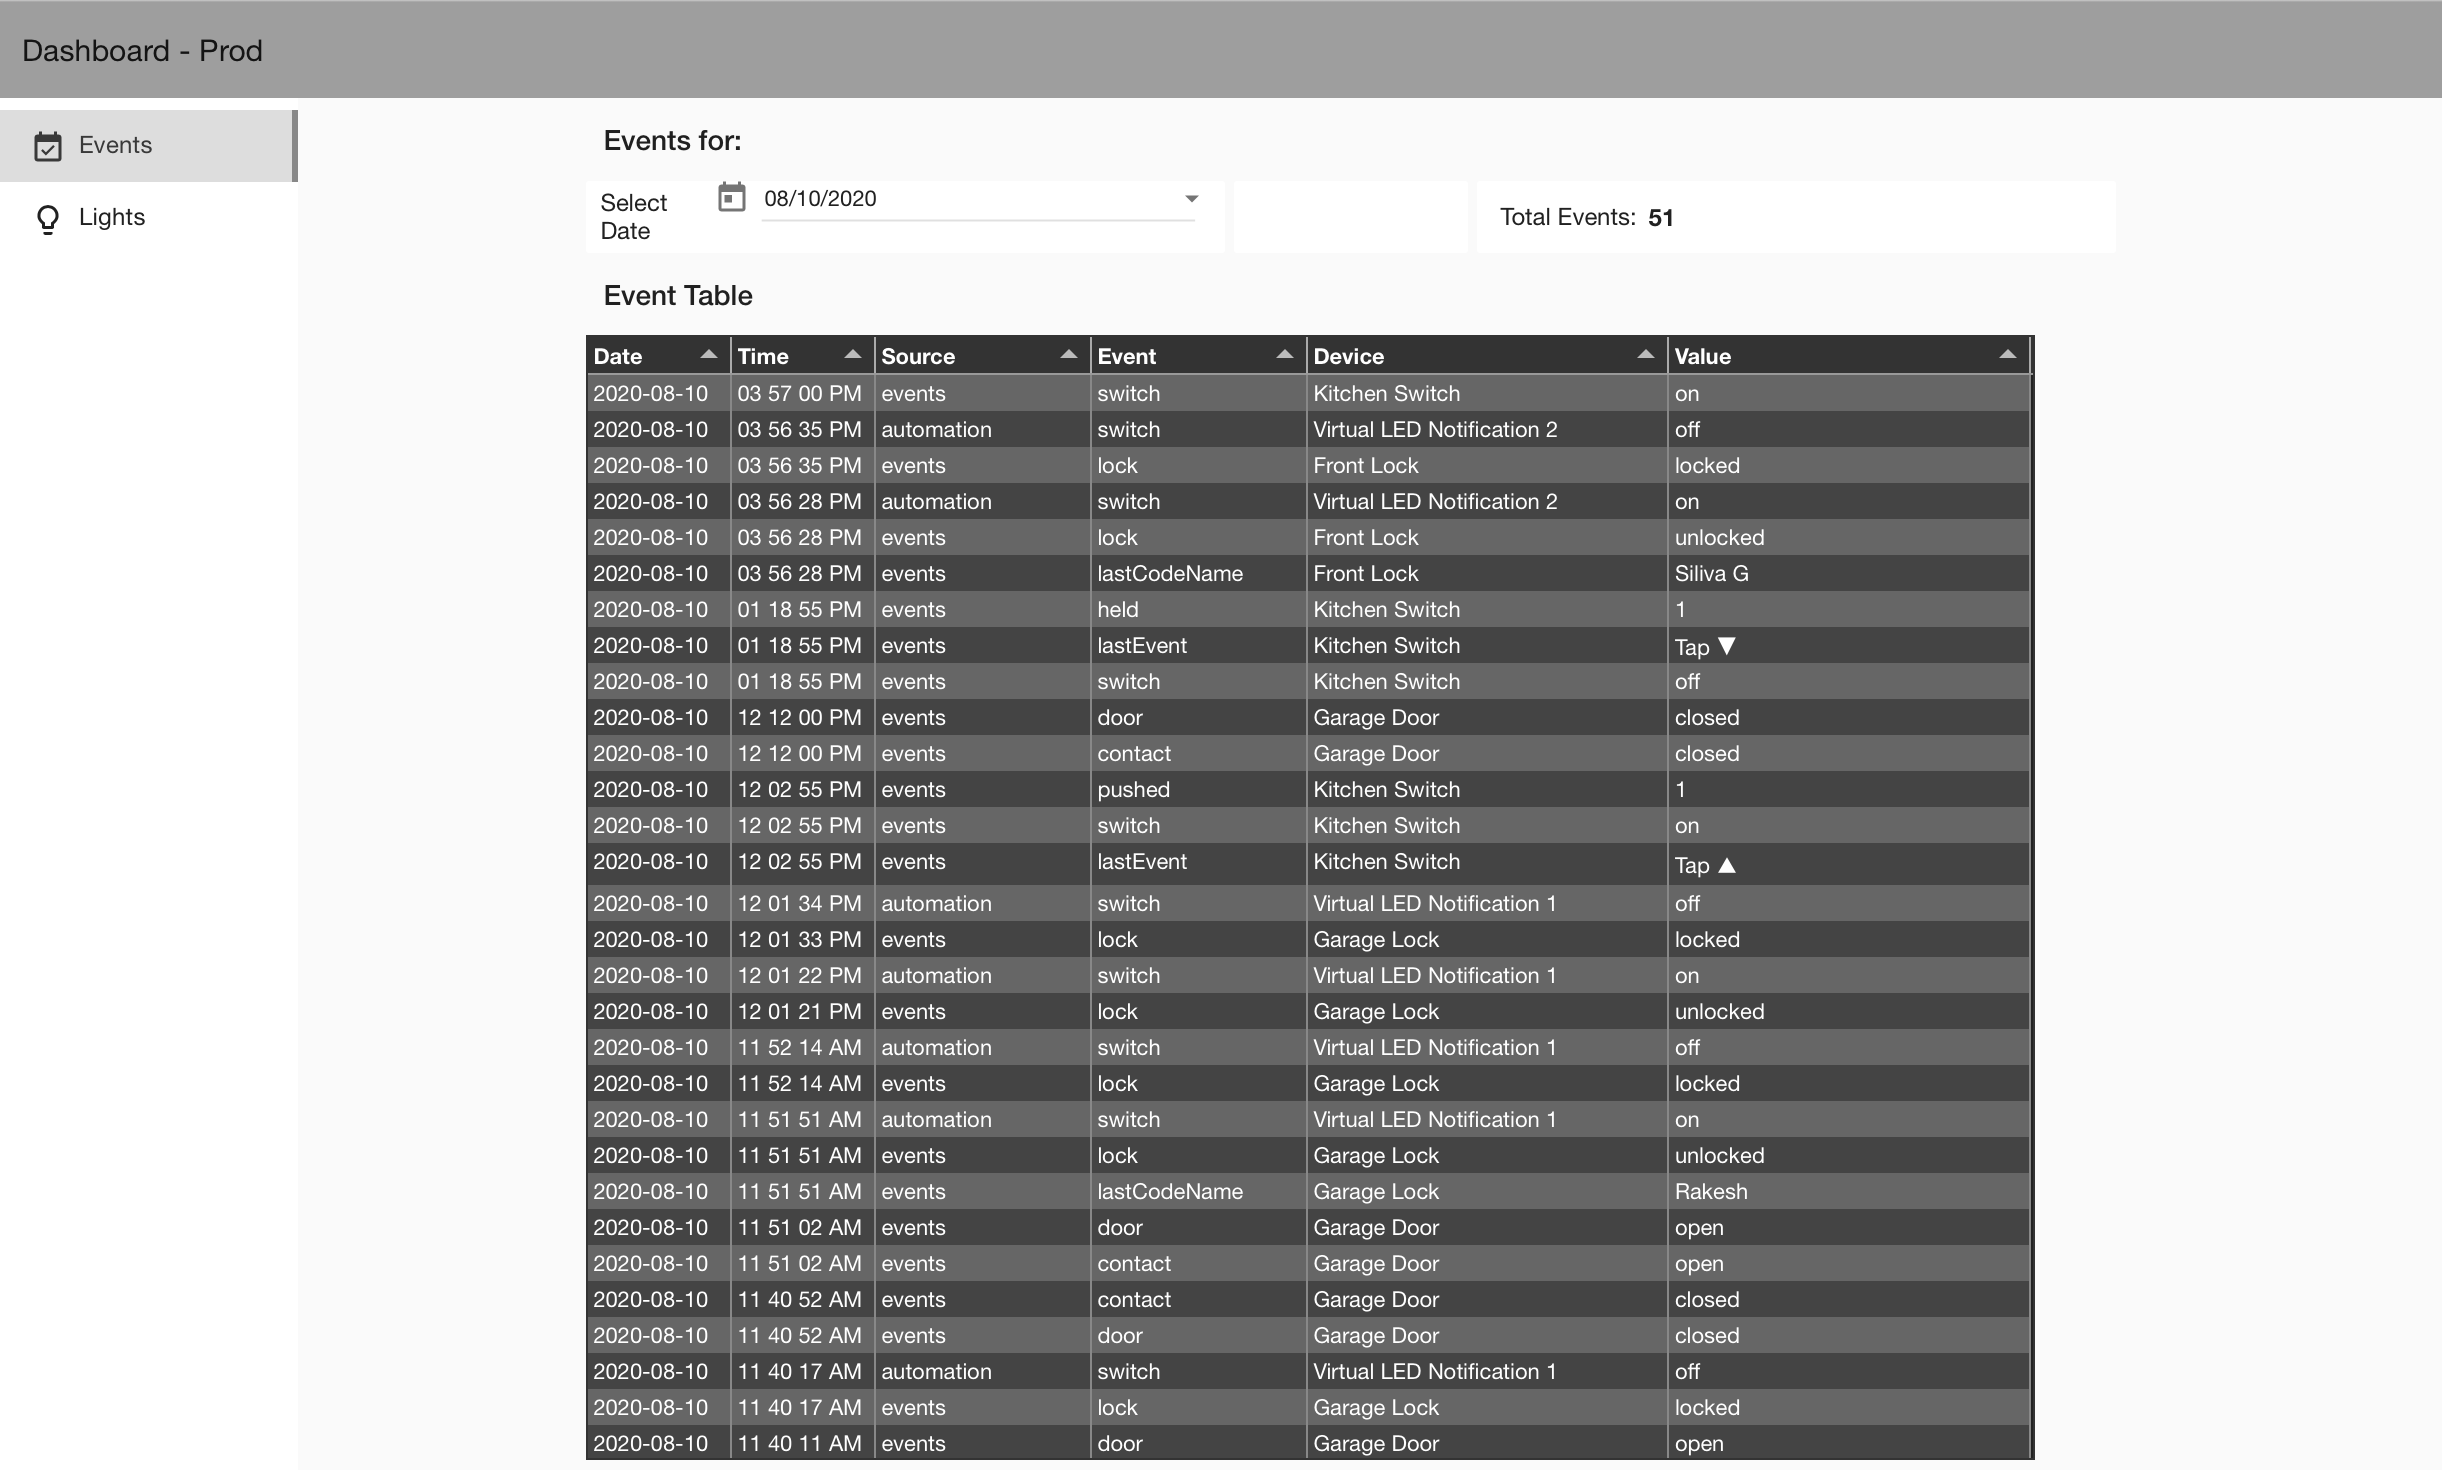
Hope this helps. I am sure there are better (and simpler) ways to do this but I had fun doing it  Let me know if anyone has questions or wants the actual Node-RED flows.
2 Likes