With the demise of Hubigraph what is not the default graphing tool for Hubigraph?
If there is not one - is one in the plan?
With the demise of Hubigraph what is not the default graphing tool for Hubigraph?
If there is not one - is one in the plan?
The problem their is the perception by some, and i am one of them that will say the Hubitat hub is the wrong tool for that job. The Hubitat Hub is a HA engine, and isn't a tool for analytics and graphs. My suggestion would be to get a Raspberry Pi, set it up to boot from USB, get a USB SSD drive and load it with Raspberry Pi os, Grafana, and influx DB. You don't need one with much ram if you aren't loading a ton of stuff on it.
This would give you a low power always on Analytics tool and Time Series based database.
InfluxDB can be integrated in many great ways and works well with a ton of things. Grafana is a enterprise level analytics too and is very flexible.
Now I know that isn't what someone wanting to keep everything in one place wants to hear, but it is likely the best idea for a long term option.
If you already have a always on system like a NAS you may be able to run both of those things on that platform as well. I run both Grafana and InfluxDB on my unraid server.
Thanks
Do you know if there a FAQ/Guide on getting the data out of HE and setting up a Raspberry PI - I have a PI 3 not doing anything,
Idiots guide to setting it all up?
I also have a Plex Server/DVR running 7x24 so could use that.
Phew thats a good thread. I've been itching for a reason to learn node red anyway. I see that the creator is using SQL and its interchangeable with whatever. I'm a PowerBI builder and I could probably build some pretty stupid (and pretty) visualizations. A lot of inspiration and creative juices started flowing as a result of you placing this thread here.

You're welcome
That is really helpful and appreciated, and seems to answer the question about default graphing solution for Hubitat after the end and now non working Hubigraph 
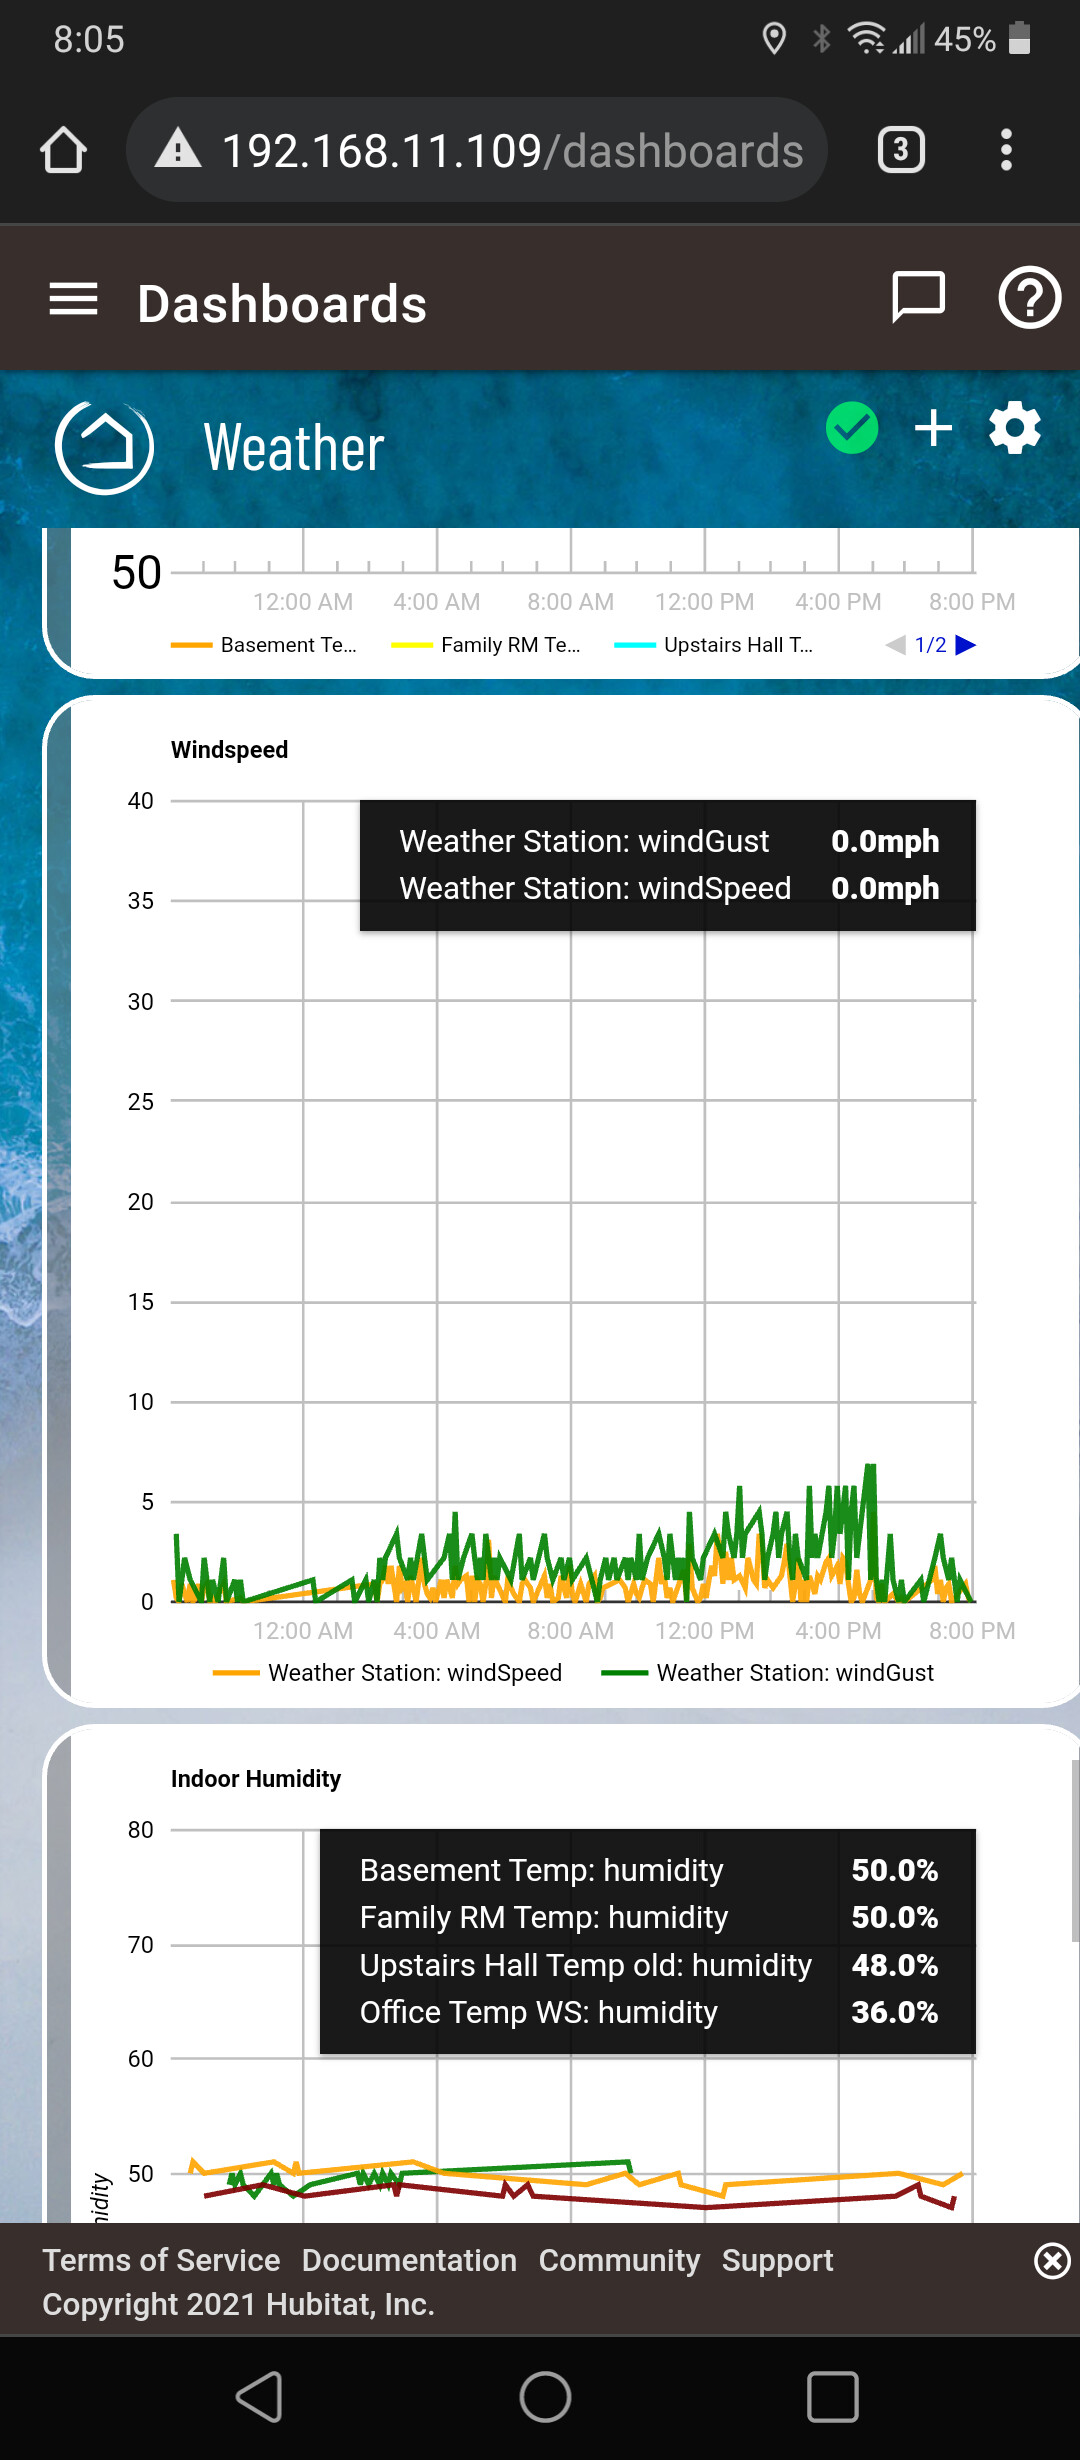
Without even basic graphing available without a significant investment of effort it is not possible to track heating, temperatures over time easily.
A blow to Hubitat functionality going forward unfortunately.
Seems like some of the issues are for those using long-term storage, although I'm only basing that on comments from two users. I don't use it myself.
i am still using long term storage.. i did have some issues and had to delete and recreate some of my storage data.
I know this probably isn't what you want to hear but the other solution provided through node-red, I started the setup a couple hours ago and I'm well on my way to a hubigraph replacement.
Just wanted to offer you some encouragement if you wanted to try it. I'm not an expert by any means and I'm doing all of this stuff (the logging/graphing) for the very first time.
I know its not for everyone but I'm techy and I'd be willing to help you through it if you wanted to 
That is incredibly generous, and very much appreciated.
I have concerns about using code red or anything that requires an external connection to operate. I feel it just introduces another risk to manage.
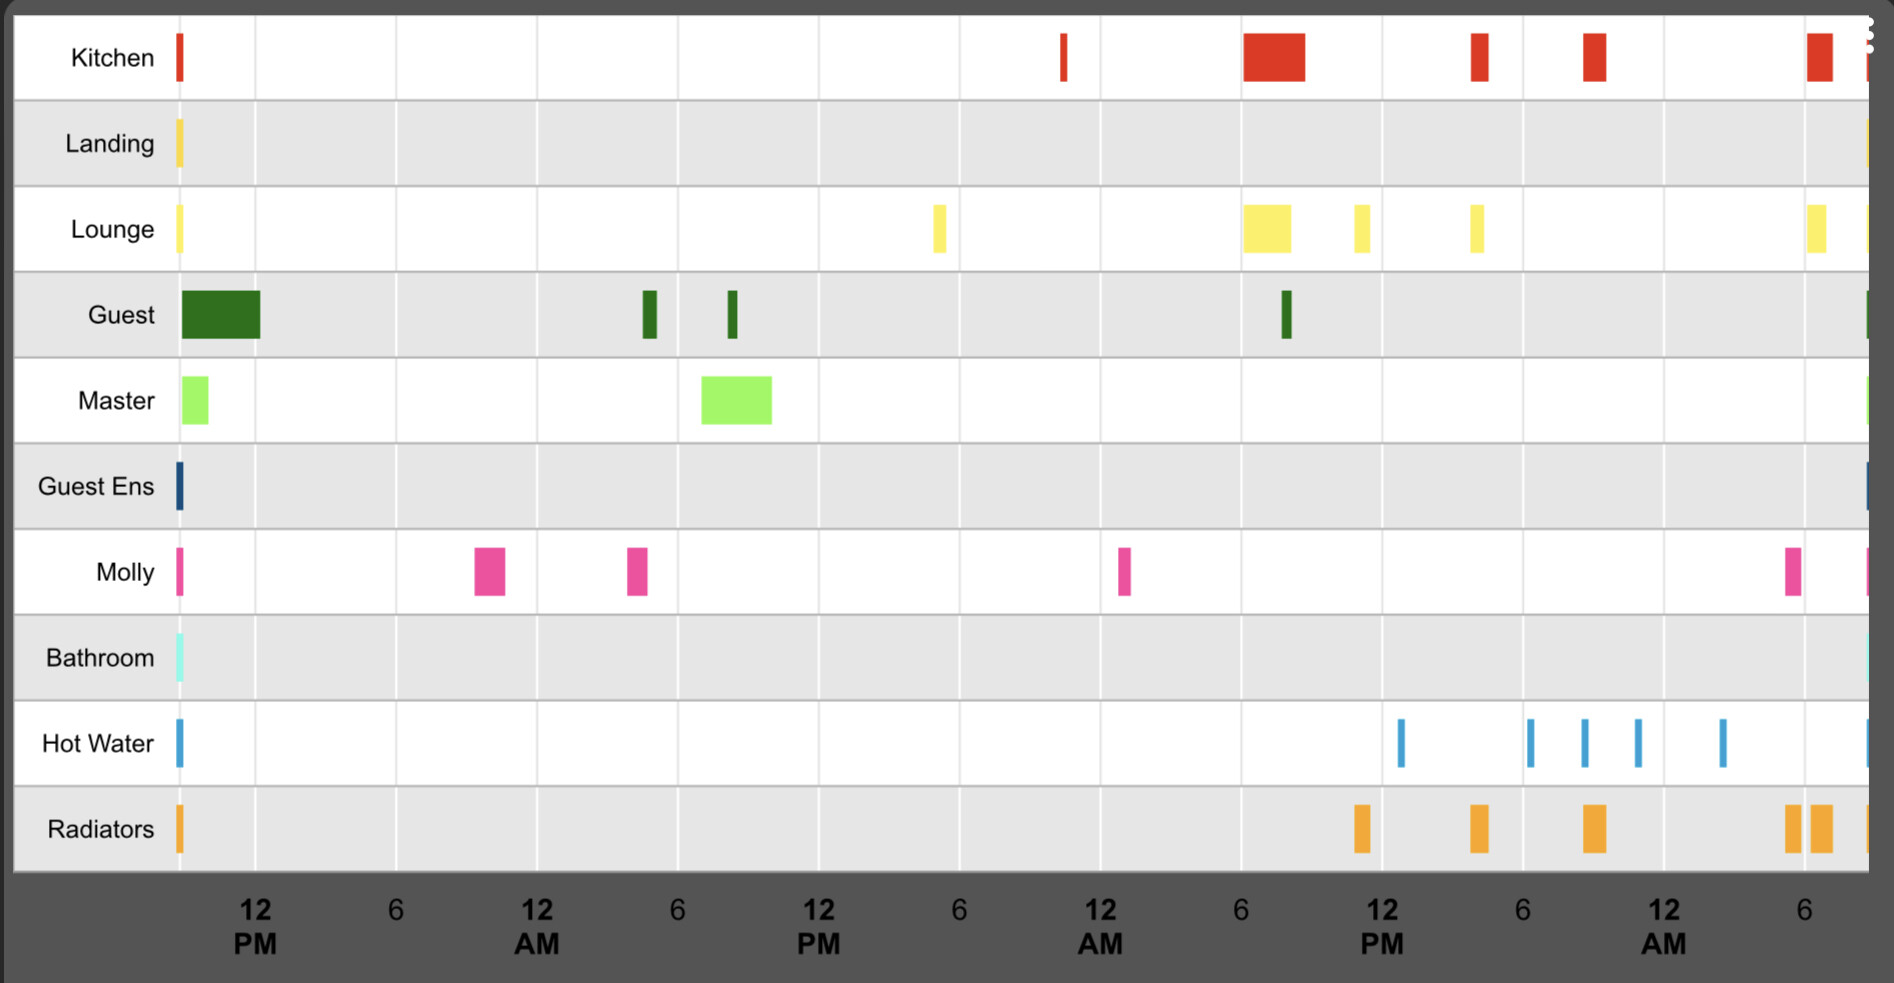
I run two hubs, one to manage zwave, the heating, thermostats, hot water, radiators, most sockets, the other zigbee lighting, temperature, motion, door sensors, it also provides oversight of the Heating System.
But I like the idea of Code Red and of course makes migrating to another HA hub easier (in most cases)
I need to think about this, but the demise of Native Graphing on HE is a problem.
Again thank you so much.
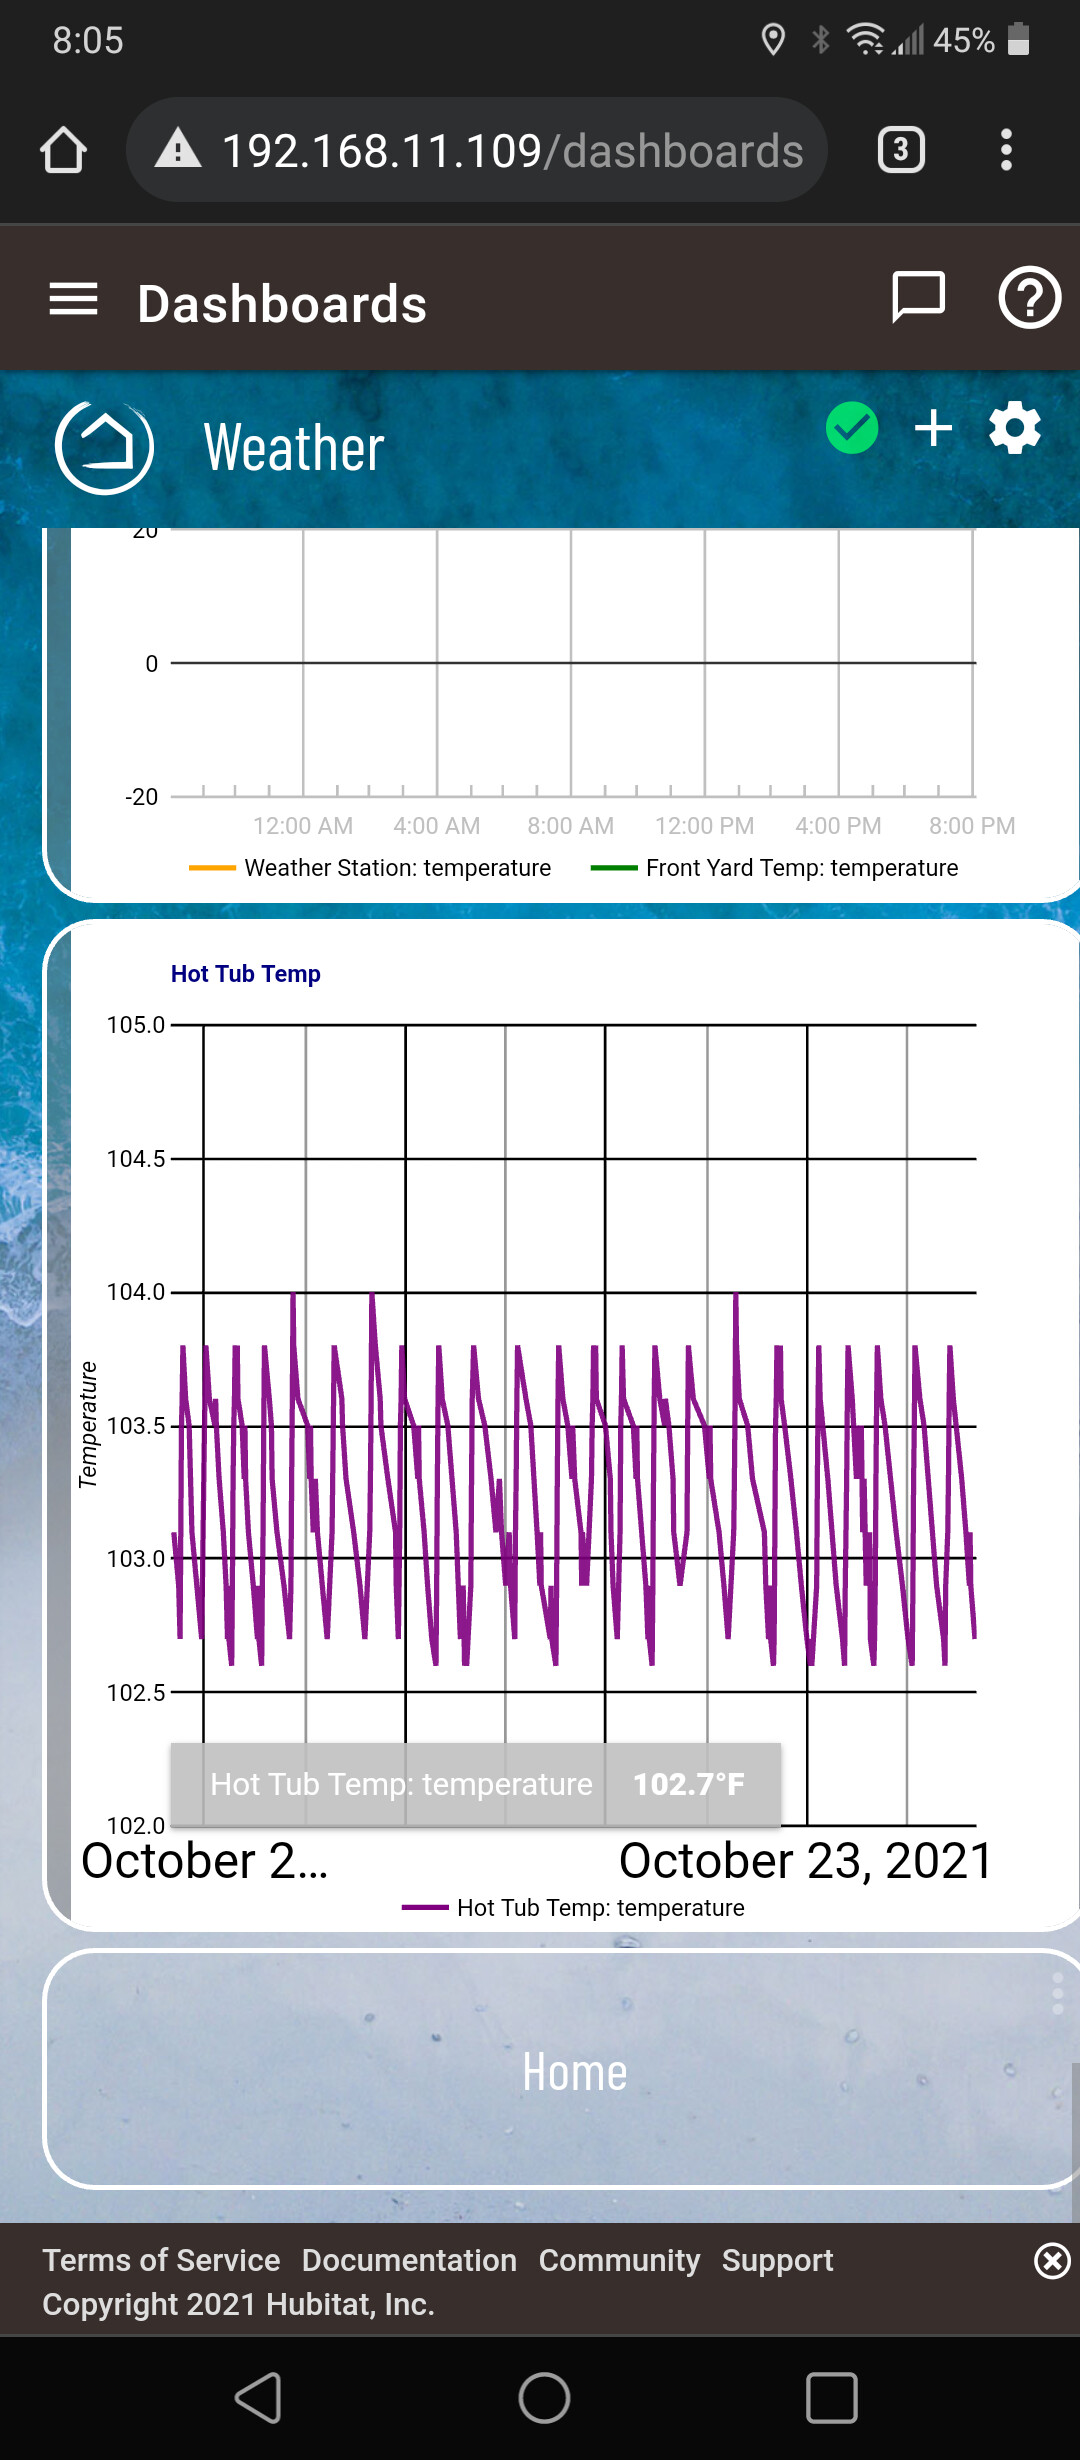
That is great, on mine certain critical devices, boiler, hot water, all the thermostats, power consumption on freezers and a few other things can now only graph the last 2 hours over the week graph.
I have removed them from LTS and increased the event logging so know the data is there but Hubigraph just can’t process it.
So very pleased yours is still working, but mine is failing..
I have disabled long term storage for the key devices and despite having all the data in place Hubigraph only displays the last 2hours on the weekly graphs.
While I did not use the graphing feature, I expect it is using the events on your devices, where LTS is not available. If you are only storing something like 100 events per device, that would put you in the 2 hour ballpark, if they record a reading every minute, on average. If this is likely, maybe try adjusting the number of events being stored and whether that changes the charts.
Key devices, the Freezers and others are only showing last 75mins of data, the devices themselves have all the data.
The key devices are storing the last 300 events.
The energy consumption is being recorded every 30 minutes.
So should be graphing the last 6.25 days…
I get about 75 mins on the graphing, so I have lost ability to see if the freezers are running with right amount of energy (1st indicator of a failing freezer is power consumption changes) unless I log in every night at midnight.
Which has given me and idea, I can put a schedule on that sends me the end of day energy usage report for key devices, which solves part of the problem.
Given me some thoughts about circumventing lack of graphing, but they are still only a temporary fix.
Need to look at alternate systems that provide graphing, investigate Node Red and keep trying to get Hubigraph working.
My preference is to remain with HE, but not being able to graph (reliably with more that 75 mins of data) is a major issue and not sustainable for me.
I certainly share your interest in having charts to look at, and I have setup InfluxDB and Grafana, though using a slightly different setup, I'll try and find the thread for you. But still using a raspberry pi, etc.
But while monitoring conditions can be useful when you need to make decisions, if you need to ensure you react when things go wrong, then I think the more important element is a system to monitor conditions for you and send an alert when action is required. It sounds like you have started thinking in that way now with your thoughts around a potential rule.
Like I said, if you did get an alert of some kind, it is still useful to see a bigger picture through some charts.
And yes, those settings for the device events should mean you see more results than you are seeing.
Simon
This is the alternative integration with InfluxDB that I use
I will.post my version of the apps I have running. Maybe that will.help. mine are not the latest. Didn't update past last march.
Also unfort. I don't have all the sources. I deleted the graphs I was not using to save space.
Download the Hubitat app