That's very doable. Just need to pull out the label, name, date and value. How are you storing the data now? In a file, device or are you capturing it live somehow?
I'm not storing it yet. The HTML file I wrote just calls Maker API to get the currently record events for the device. If you look on the App page for an install of Maker API there is a device events URL you can call to get the output I showed in my last post. I'd post a screenshot, but too many access tokens to blank out ![]()
Okay, Sounds interesting. I'll take a look in a little bit.
1 Like
Thanks.
If I was going to do it myself I may not have used MakerAPI, I believe you can expose endpoints via an App, but I could be wrong. I was thinking of allowing the user to select the devices in an App I developed and this would provide both "live" event reporting and/or longer term reporting using storage of the data locally.
Yup, that's what I'm doing too. Users can select "event data" stored in any device (that's the way the version already uploaded works) or choose to store longer durations (more data points) in a file (option included in the next beta).
1 Like
Hmmm... There are other things I want to do in this space, i.e. inside my app, so it may actually make more sense for me to include this file storage option inside my own app, as much as I wouldn't want to repeat the same feature.... Still would be good for the two apps to have consistent outputs, if nothing else.
1 Like
Okay, time for a break. 
New bundle available...
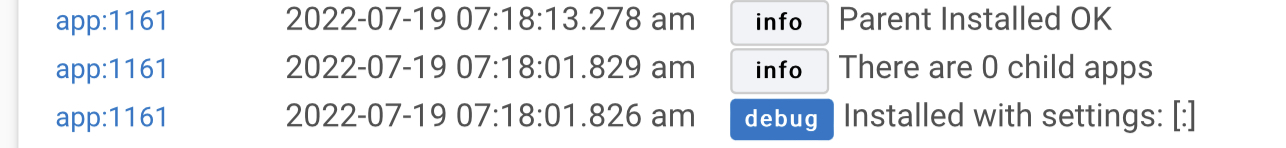
0.0.5 - 07/16/22 - Data collection! New child app 'Quick Chart Data Collector'
4 Likes
I am confirming that after I updated the bundle, I do get the chart and it seems to work as expected. Thank you @bptworld for that.
Looking forward for the next development steps.
Thanks,
1 Like
New bundle available...
0.0.7 - 07/18/22 - Fun with File data
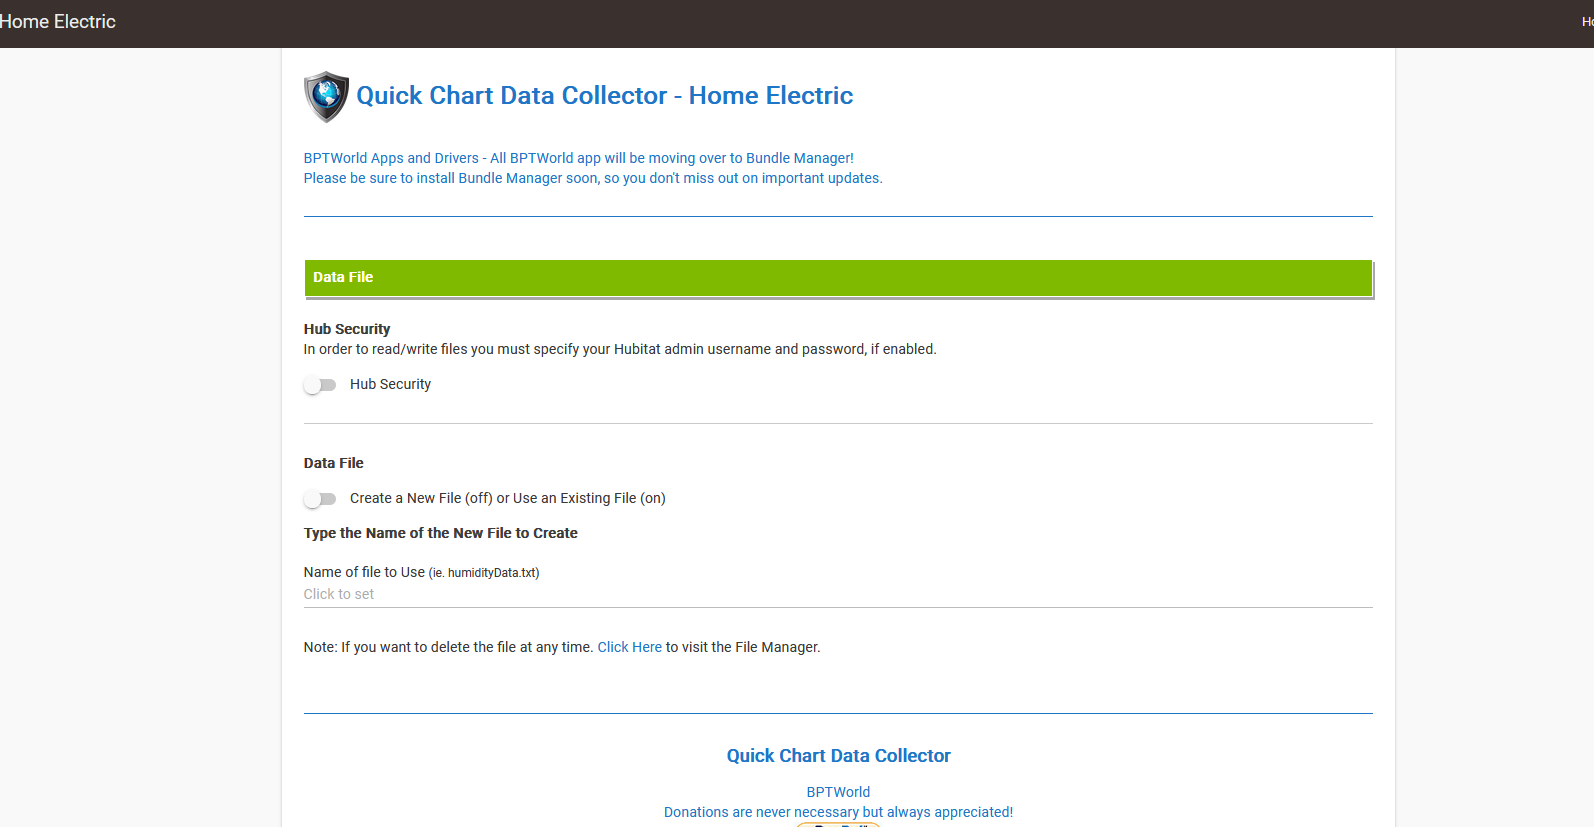
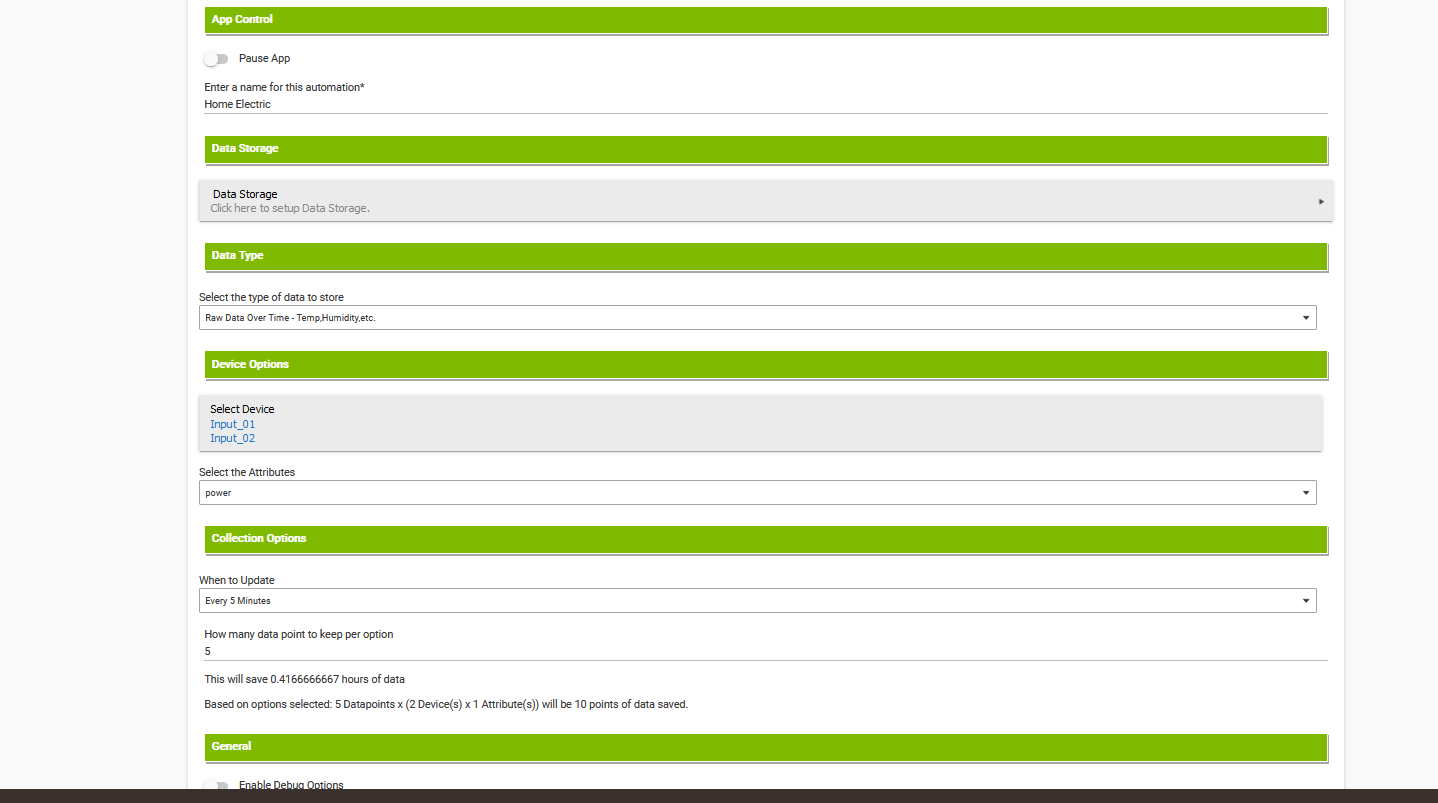
Coming along nicely. On the Data Storage page of the Data Collector child app, it's a bit unclear to me what to do. Might be good to clarify whether the switch being on indicates a new file or existing file. Also, is there supposed to be a Next button? A file is never created for me - maybe because i never click any sort of button to trigger its creation?
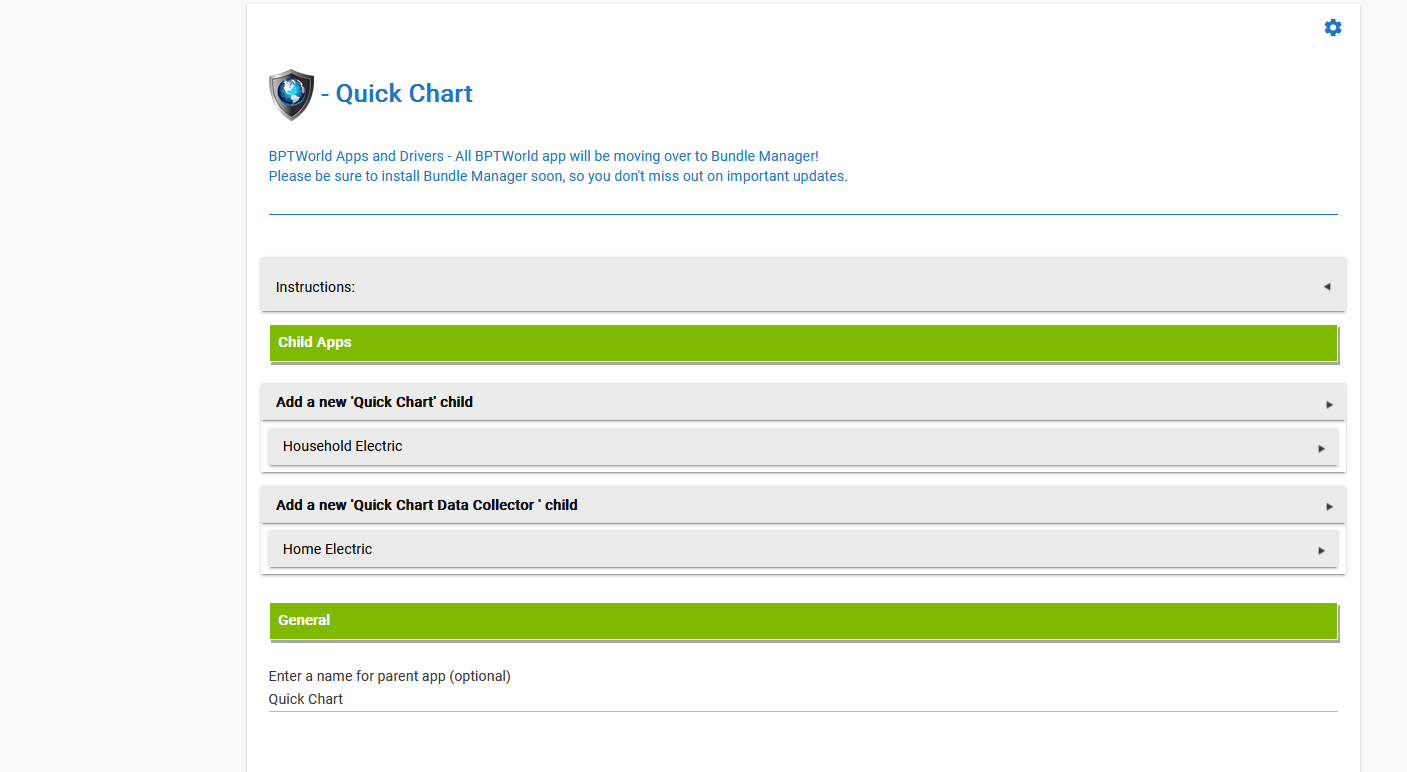
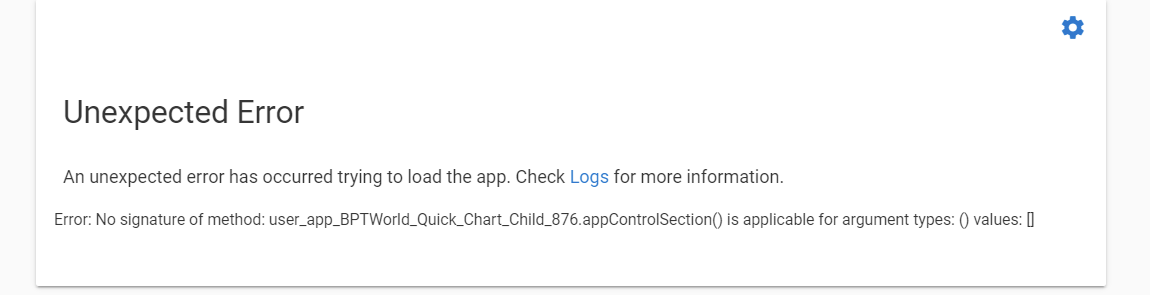
@bptworld - just installed Quick Chart for the first time and when I hit add new quick chart I get an unexpected error. I got the same error when trying data collection also.
Update your Normal Stuff Library
Hi,
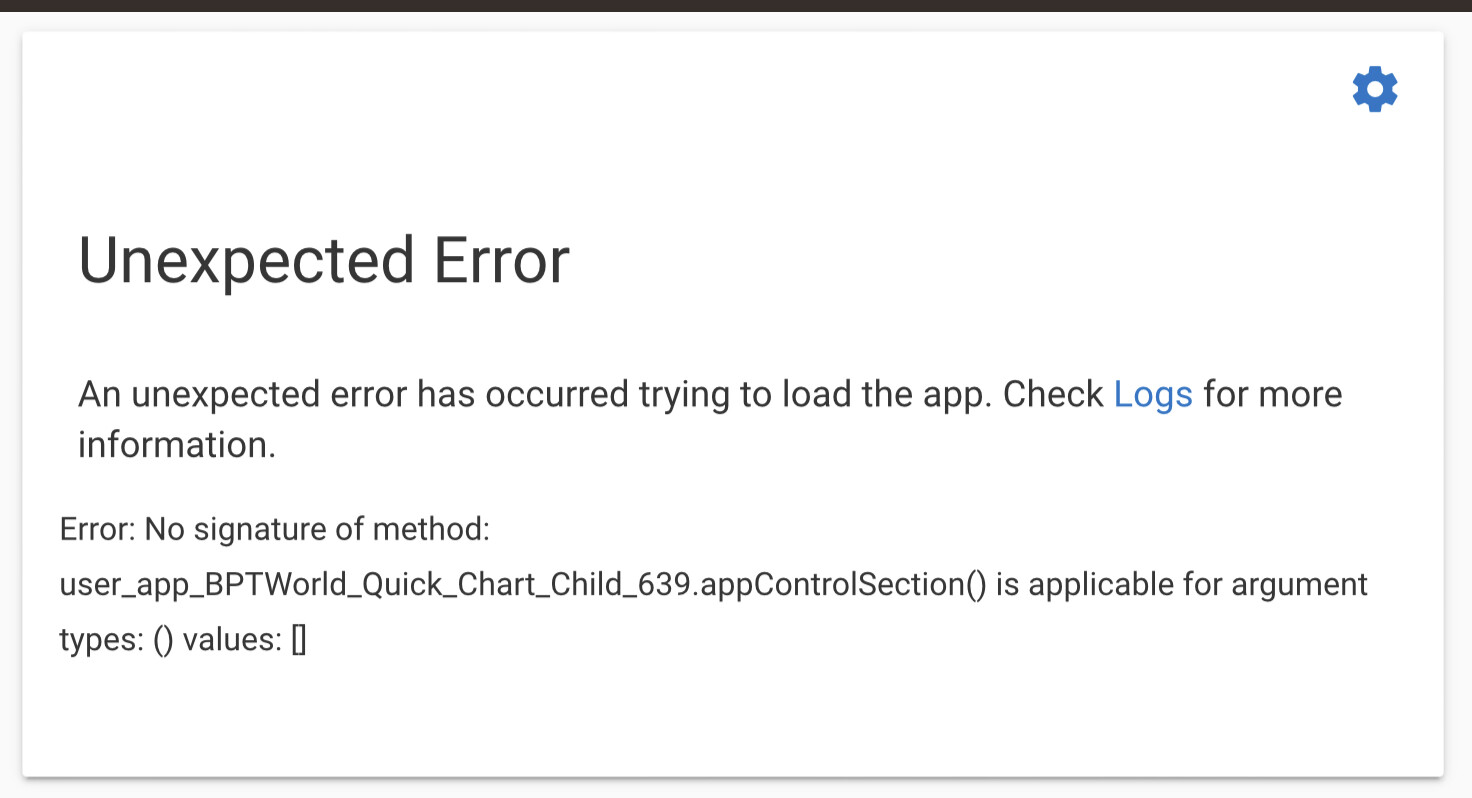
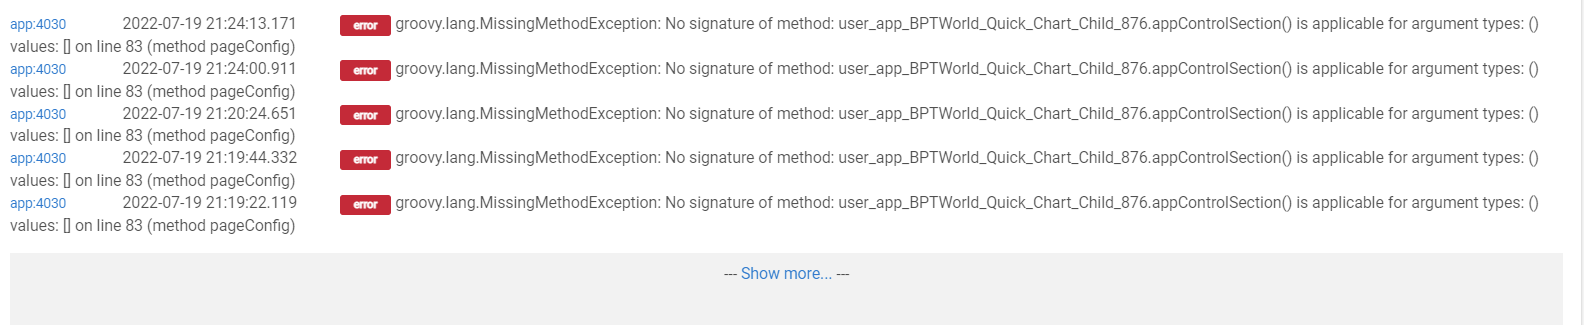
After updating the bundle this morning I came back to the dashboard to find this:
Went to the app and when clicking the child app I get this screen:
I was on v1.1.6. I went ahead and installed Normal Stuff Library again from your Bundle Manager and still got the exact same error. I also confirmed that in the Library code section that I indeed have v1.1.6 installed.
I also removed Quick Chart and added it back fresh to test.
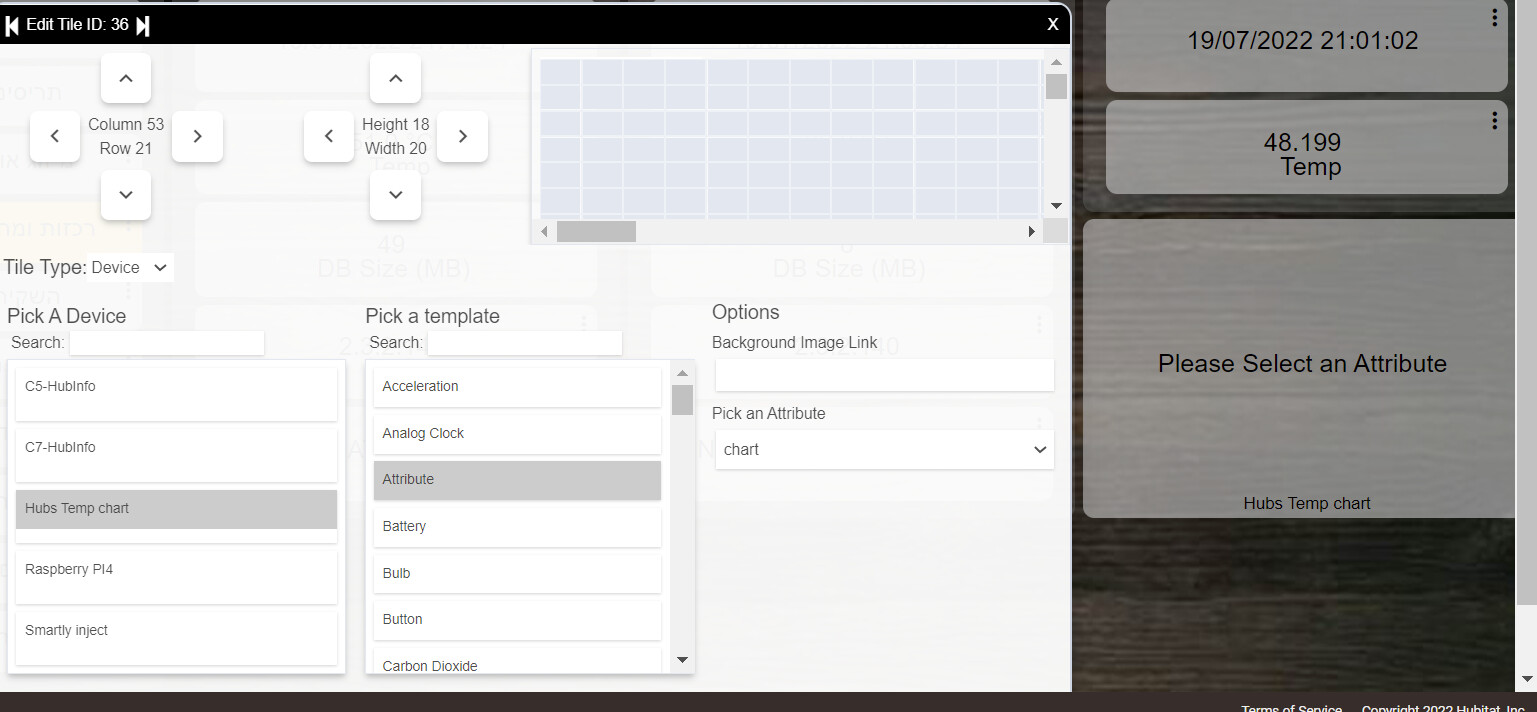
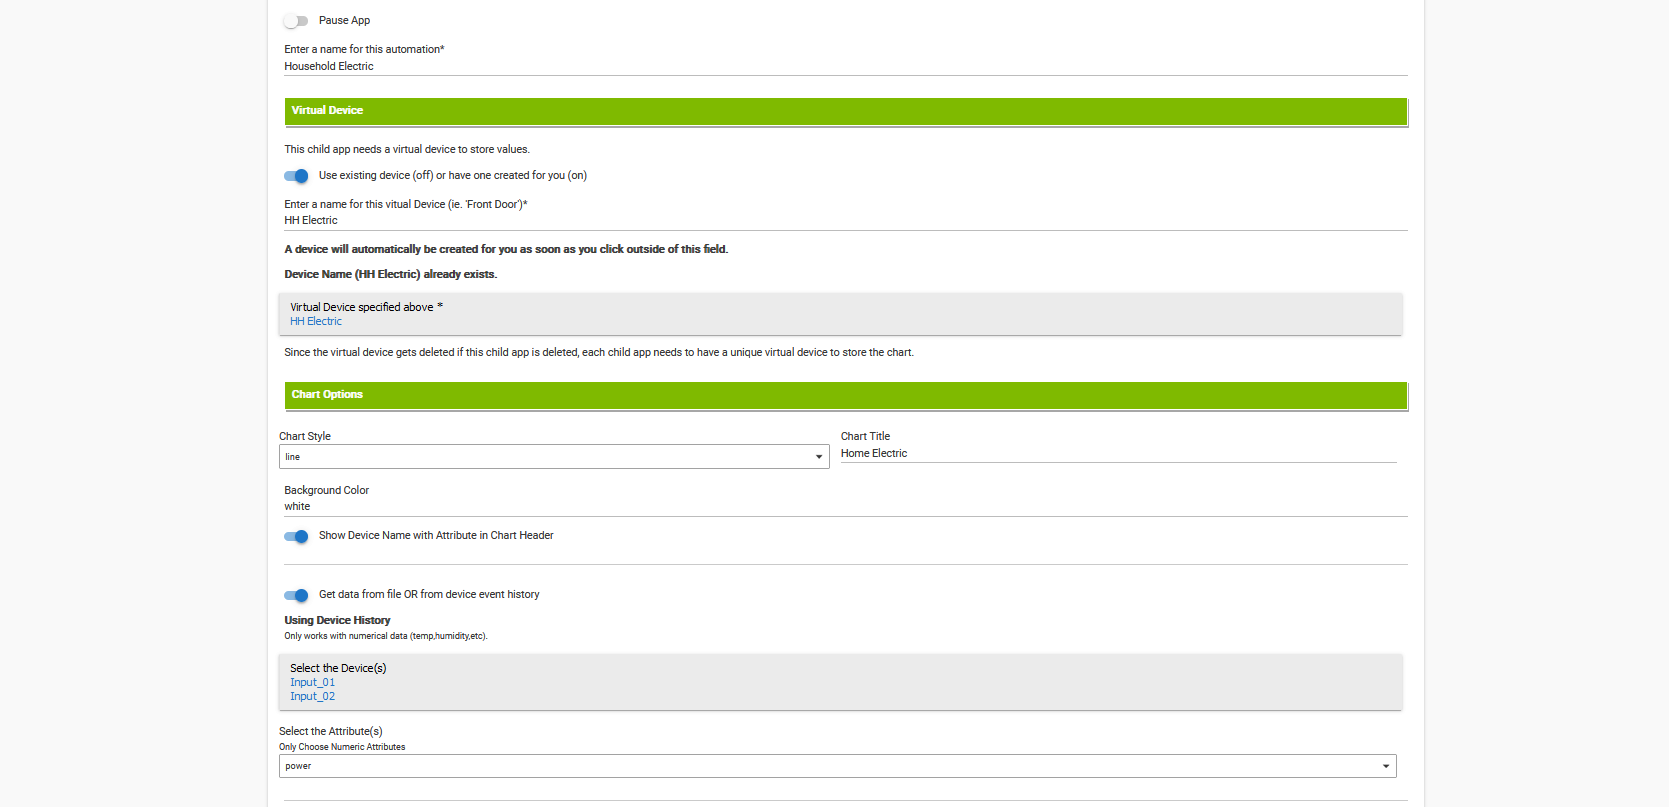
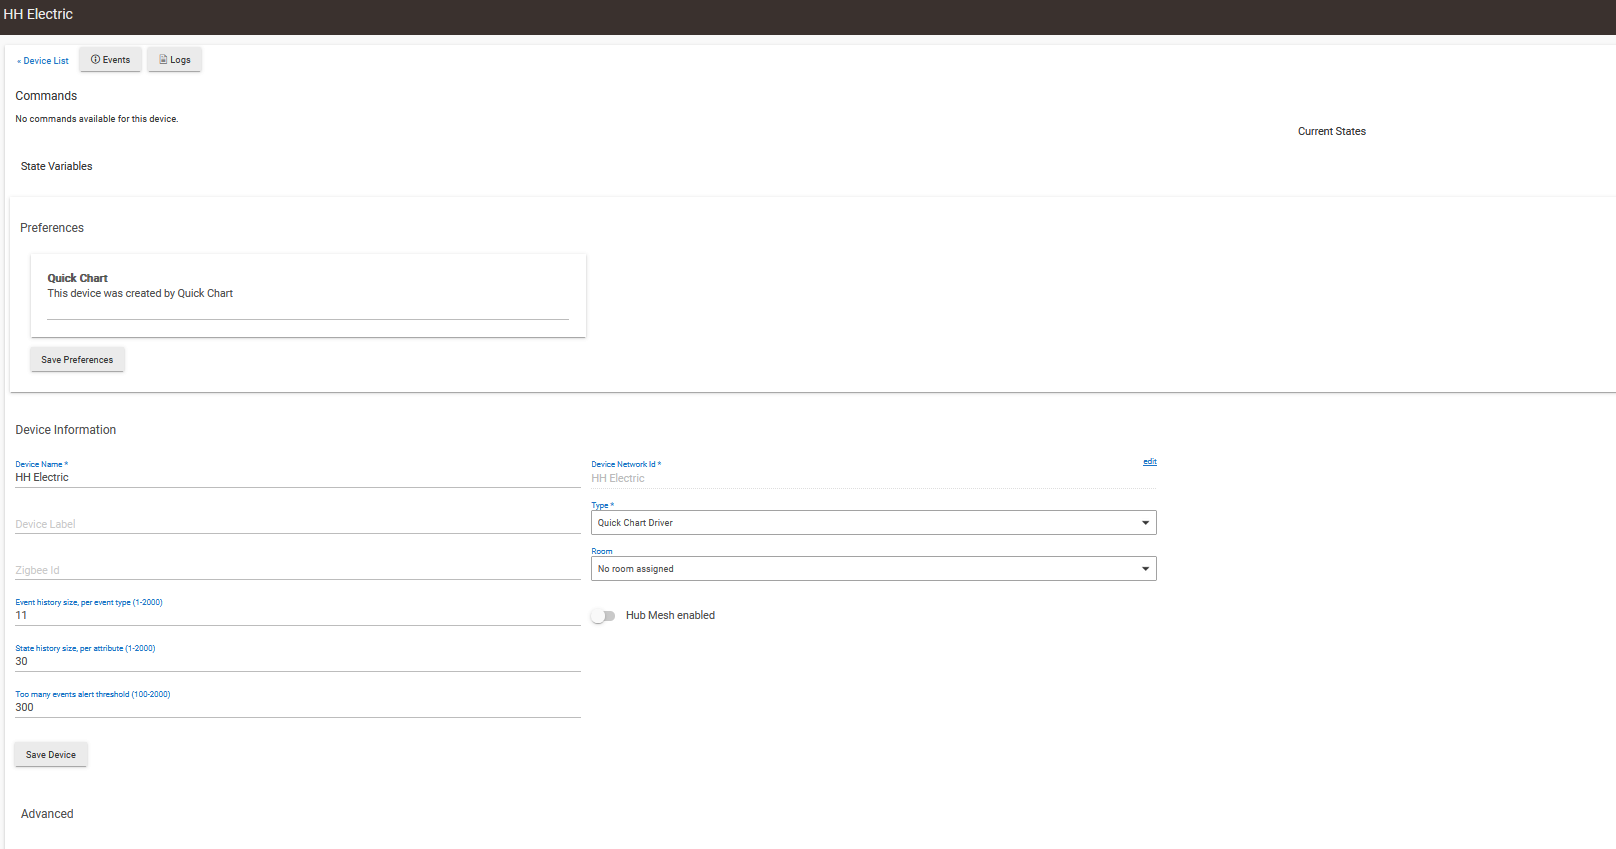
@bptworld Installed this morning and not sure what I'm doing wrong. As you can see there aren't any attributes displayed on the device page 
filename under datastorage=hhelectric
Looks like I introduced a nasty bug in the last beta. I just pushed a new bundle to fix it.
0.0.8 - 07/20/22 - Squished a nasty bug, working on dashboard tile
There won't be until you run a chart. Then there will be only 2, simple and clean.
In your second screenshot
How are you making this file? All data must come straight from the 'device events' or using my 'Quick Chart Data Collector'.
One thing that I'm still stuck on is putting the chart into an iFrame to display on the dashboard. I know how to put it in the iFrame but can't figure out how to make it adjust to the size of the window. ![]() Might have to call in @thebearmay !
Might have to call in @thebearmay ! ![]()
The call that makes the chart doesn't return an actual image, just the command to make the image. If right click on the image shown in the attribute, open in new window, the title bar shows the command string. Not theImage.png or similiar....
(also still working on some graph order issues. ![]() Got to love beta!)
Got to love beta!)
If
height: 100%;
width: 100%;
doesn't work I usually try something like
height: 100vh;
width: 100vw;
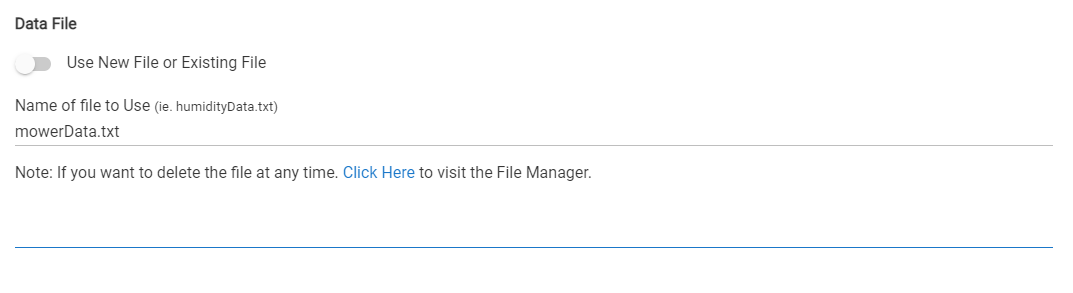
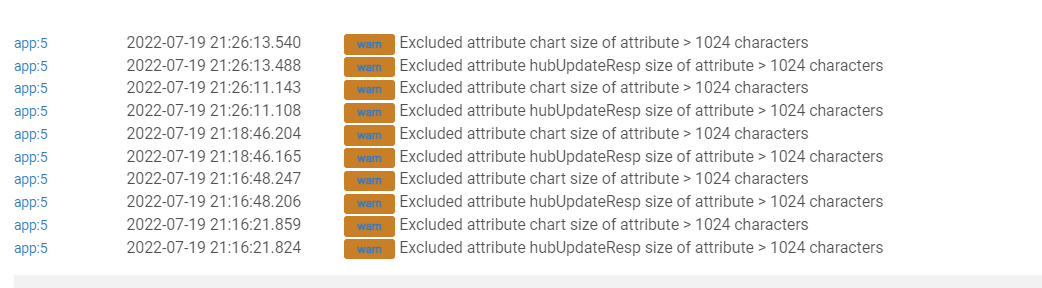
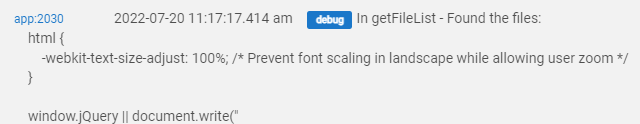
I'm beta testing the data storage part, but having some issues. No new file is ever created for me. Log doesn't show anything about why. So, I manually uploaded a text file and tried to select to use that instead. But the text file doesn't show up in the dropdown list. I added a debug line to see what the list of files returned was, but am getting some odd response rather than the list of files:
Modified this line to output the resp.data to the log:
if(logEnable) log.debug "In getFileList - Found the files: ${resp.data}"
And I get this:
Whereas if I just type the URI (uri = "http://${location.hub.localIP}:8080/hub/fileManager/json") into the browser window I get the actual list of files:
{"files":[{"date":"1658329360000","size":"0","name":"mowerData.txt","type":"file"}],"path":null,"freeSpace":999995904}
Not sure what's going on there. Hub security maybe?