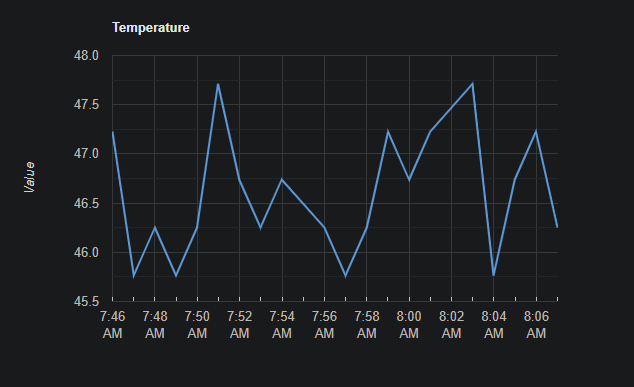
Not sure if I will take this anywhere, but thought I would play around with a small HTML file that could be hosted on the HE hub to display a numeric attribute value over time in a Line Chart. You just need to have the device available in a Maker API instance, populate the variables at the top of the readInDeviceData function and upload the html file to the HE hub local file storage. Not the way I would want to have this setup in the end, but something to get me started in playing around with this bit of code...
<script type="text/javascript" src="https://code.jquery.com/jquery-3.6.0.js"></script>
<script type="text/javascript" src="https://maxcdn.bootstrapcdn.com/bootstrap/3.3.7/js/bootstrap.min.js"></script>
<script type="text/javascript" src="https://github.com/evanplaice/jquery-csv/blob/main/src/jquery.csv.js"></script>
<script type="text/javascript" src="https://www.gstatic.com/charts/loader.js"></script>

<script>

function readInDeviceData() {

	var heHubIp = "";
	var makerAppNo = "";
	var makerToken = "";
	var deviceId = "";
	var deviceAttribute = "";

	var deviceData = new google.visualization.DataTable();
	deviceData.addColumn('date', 'DateTime');
    deviceData.addColumn('number', deviceAttribute);

	$.ajax({
		  type: "GET",
		  dataType: "json",
		  url: "http://" + heHubIp + "/apps/api/" + makerAppNo + "/devices/" + deviceId + "/events?access_token=" + makerToken,
		  async: false,
		  success: function (fileData) {

			for (x=0; x< fileData.length; x++) {
				if (fileData[x].name = deviceAttribute) { deviceData.addRow([new Date(fileData[x].date), Number(fileData[x].value)]); }
			}

		  }
		  }).fail(function(jqXHR, textStatus, errorThrown) {
					console.error(jqXHR, textStatus, errorThrown);
					console.error(jqXHR.responseJSON);
					if (errorThrown == 'Not Found') {
													  alert("Warning: The device data could not be read");
													  return null;
													}
					else {
						   alert("Error reading the device data: " + errorThrown);
						   return null;
						 }
				});
	return deviceData;
}

function drawChart() {


var data = readInDeviceData();

// Set Options
var options = {
  title: 'Temperature',
  //hAxis: {title: 'Time'},
  vAxis: {title: 'Value'},
  legend: 'none'
};
// Draw Chart
var chart = new google.visualization.LineChart(document.getElementById('myChart'));
chart.draw(data, options);
}
</script>


<div id="myChart" style="max-width:700px; height:400px"></div>

<script>
google.charts.load('current',{packages:['corechart']});
google.charts.setOnLoadCallback(drawChart);
</script>


