Yes, while in beta it's always best to delete and start again with new builds
Nope. I have no idea what Maker API returns BUT if you send me an example we might be able to come up with some sort of converter.
Yes, while in beta it's always best to delete and start again with new builds
Nope. I have no idea what Maker API returns BUT if you send me an example we might be able to come up with some sort of converter.
Sorry, I should have disclosed my intentions first,.... Poor form on my part....
I am also looking at a charting solution, using a HTML page that reads recent device events from Maker API (at the moment), and I was wanting to make use of local storage for recording longer timeframes. I was thinking if I could read in the events in the same format as I am retrieving them from Maker API, I wouldn't need to write the code differently when interpretting the events, just use a different source.
So I was interested in whether you would consider separating out the storage of the events from the charting, so the storing of the event data could be used for any number of other purposes, not just charts.
Ha, that's how I'm doing it now. ![]() I wrote a separate child app to collect the data and write it to a file. Then that file is read back into the charting child app to produce the charts.
I wrote a separate child app to collect the data and write it to a file. Then that file is read back into the charting child app to produce the charts.
Right now I just finished setting the options for raw data like temp, humidity, etc. It simply adds to a text file when there is new data.
ie.
Going to work on time duration next. ie. How long a device has been on/active/open,etc per day.
The only difference is going to be how the collector child app works, no changes will be needed to the charting child app.
Probably not making much sense but it'll be cool when it's done! ![]()
Here's an example of what Maker API returns. I wouldn't need every key/value pair for what I am doing... It's basically an array of json elements (I'm probably not using the right terms there....
[{"device_id":"614","label":"Raspberry Pi (Analytics) Temperature","room":"Infrastructure","name":"temperature","value":"47.225","date":"2022-07-16T21:50:59+0000","unit":"\u00b0C","isStateChange":true,"source":"DEVICE"},{"device_id":"614","label":"Raspberry Pi (Analytics) Temperature","room":"Infrastructure","name":"temperature","value":"46.738","date":"2022-07-16T21:48:59+0000","unit":"\u00b0C","isStateChange":true,"source":"DEVICE"},{"device_id":"614","label":"Raspberry Pi (Analytics) Temperature","room":"Infrastructure","name":"temperature","value":"47.712","date":"2022-07-16T21:48:00+0000","unit":"\u00b0C","isStateChange":true,"source":"DEVICE"},{"device_id":"614","label":"Raspberry Pi (Analytics) Temperature","room":"Infrastructure","name":"temperature","value":"46.738","date":"2022-07-16T21:47:00+0000","unit":"\u00b0C","isStateChange":true,"source":"DEVICE"},{"device_id":"614","label":"Raspberry Pi (Analytics) Temperature","room":"Infrastructure","name":"temperature","value":"47.712","date":"2022-07-16T21:44:00+0000","unit":"\u00b0C","isStateChange":true,"source":"DEVICE"},{"device_id":"614","label":"Raspberry Pi (Analytics) Temperature","room":"Infrastructure","name":"temperature","value":"48.199","date":"2022-07-16T21:43:00+0000","unit":"\u00b0C","isStateChange":true,"source":"DEVICE"},{"device_id":"614","label":"Raspberry Pi (Analytics) Temperature","room":"Infrastructure","name":"temperature","value":"46.738","date":"2022-07-16T21:41:59+0000","unit":"\u00b0C","isStateChange":true,"source":"DEVICE"},{"device_id":"614","label":"Raspberry Pi (Analytics) Temperature","room":"Infrastructure","name":"temperature","value":"47.712","date":"2022-07-16T21:40:59+0000","unit":"\u00b0C","isStateChange":true,"source":"DEVICE"},{"device_id":"614","label":"Raspberry Pi (Analytics) Temperature","room":"Infrastructure","name":"temperature","value":"47.225","date":"2022-07-16T21:39:59+0000","unit":"\u00b0C","isStateChange":true,"source":"DEVICE"},{"device_id":"614","label":"Raspberry Pi (Analytics) Temperature","room":"Infrastructure","name":"temperature","value":"46.738","date":"2022-07-16T21:38:59+0000","unit":"\u00b0C","isStateChange":true,"source":"DEVICE"},{"device_id":"614","label":"Raspberry Pi (Analytics) Temperature","room":"Infrastructure","name":"temperature","value":"47.225","date":"2022-07-16T21:38:00+0000","unit":"\u00b0C","isStateChange":true,"source":"DEVICE"},{"device_id":"614","label":"Raspberry Pi (Analytics) Temperature","room":"Infrastructure","name":"temperature","value":"45.764","date":"2022-07-16T21:36:00+0000","unit":"\u00b0C","isStateChange":true,"source":"DEVICE"},{"device_id":"614","label":"Raspberry Pi (Analytics) Temperature","room":"Infrastructure","name":"temperature","value":"47.225","date":"2022-07-16T21:35:00+0000","unit":"\u00b0C","isStateChange":true,"source":"DEVICE"},{"device_id":"614","label":"Raspberry Pi (Analytics) Temperature","room":"Infrastructure","name":"temperature","value":"46.738","date":"2022-07-16T21:34:00+0000","unit":"\u00b0C","isStateChange":true,"source":"DEVICE"},{"device_id":"614","label":"Raspberry Pi (Analytics) Temperature","room":"Infrastructure","name":"temperature","value":"47.225","date":"2022-07-16T21:33:00+0000","unit":"\u00b0C","isStateChange":true,"source":"DEVICE"},{"device_id":"614","label":"Raspberry Pi (Analytics) Temperature","room":"Infrastructure","name":"temperature","value":"46.738","date":"2022-07-16T21:31:59+0000","unit":"\u00b0C","isStateChange":true,"source":"DEVICE"},{"device_id":"614","label":"Raspberry Pi (Analytics) Temperature","room":"Infrastructure","name":"temperature","value":"47.225","date":"2022-07-16T21:30:59+0000","unit":"\u00b0C","isStateChange":true,"source":"DEVICE"},{"device_id":"614","label":"Raspberry Pi (Analytics) Temperature","room":"Infrastructure","name":"temperature","value":"47.712","date":"2022-07-16T21:29:59+0000","unit":"\u00b0C","isStateChange":true,"source":"DEVICE"},{"device_id":"614","label":"Raspberry Pi (Analytics) Temperature","room":"Infrastructure","name":"temperature","value":"46.738","date":"2022-07-16T21:29:00+0000","unit":"\u00b0C","isStateChange":true,"source":"DEVICE"},{"device_id":"614","label":"Raspberry Pi (Analytics) Temperature","room":"Infrastructure","name":"temperature","value":"45.764","date":"2022-07-16T21:28:00+0000","unit":"\u00b0C","isStateChange":true,"source":"DEVICE"}]
That's very doable. Just need to pull out the label, name, date and value. How are you storing the data now? In a file, device or are you capturing it live somehow?
I'm not storing it yet. The HTML file I wrote just calls Maker API to get the currently record events for the device. If you look on the App page for an install of Maker API there is a device events URL you can call to get the output I showed in my last post. I'd post a screenshot, but too many access tokens to blank out ![]()
Okay, Sounds interesting. I'll take a look in a little bit.
Thanks.
If I was going to do it myself I may not have used MakerAPI, I believe you can expose endpoints via an App, but I could be wrong. I was thinking of allowing the user to select the devices in an App I developed and this would provide both "live" event reporting and/or longer term reporting using storage of the data locally.
Yup, that's what I'm doing too. Users can select "event data" stored in any device (that's the way the version already uploaded works) or choose to store longer durations (more data points) in a file (option included in the next beta).
Hmmm... There are other things I want to do in this space, i.e. inside my app, so it may actually make more sense for me to include this file storage option inside my own app, as much as I wouldn't want to repeat the same feature.... Still would be good for the two apps to have consistent outputs, if nothing else.
Okay, time for a break. 
New bundle available...
0.0.5 - 07/16/22 - Data collection! New child app 'Quick Chart Data Collector'
I am confirming that after I updated the bundle, I do get the chart and it seems to work as expected. Thank you @bptworld for that.
Looking forward for the next development steps.
Thanks,
New bundle available...
0.0.7 - 07/18/22 - Fun with File data
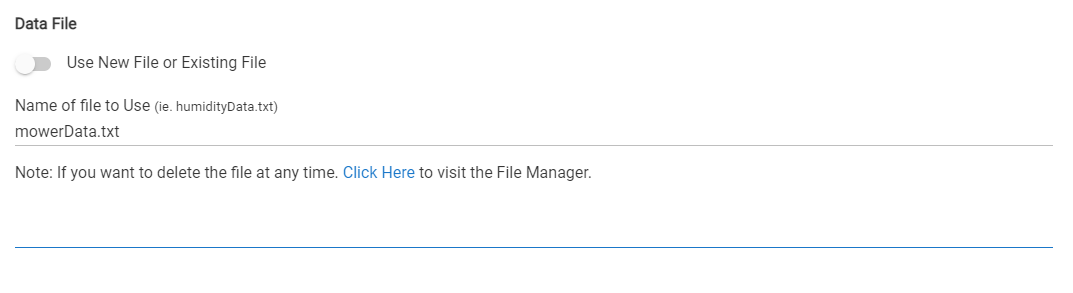
Coming along nicely. On the Data Storage page of the Data Collector child app, it's a bit unclear to me what to do. Might be good to clarify whether the switch being on indicates a new file or existing file. Also, is there supposed to be a Next button? A file is never created for me - maybe because i never click any sort of button to trigger its creation?
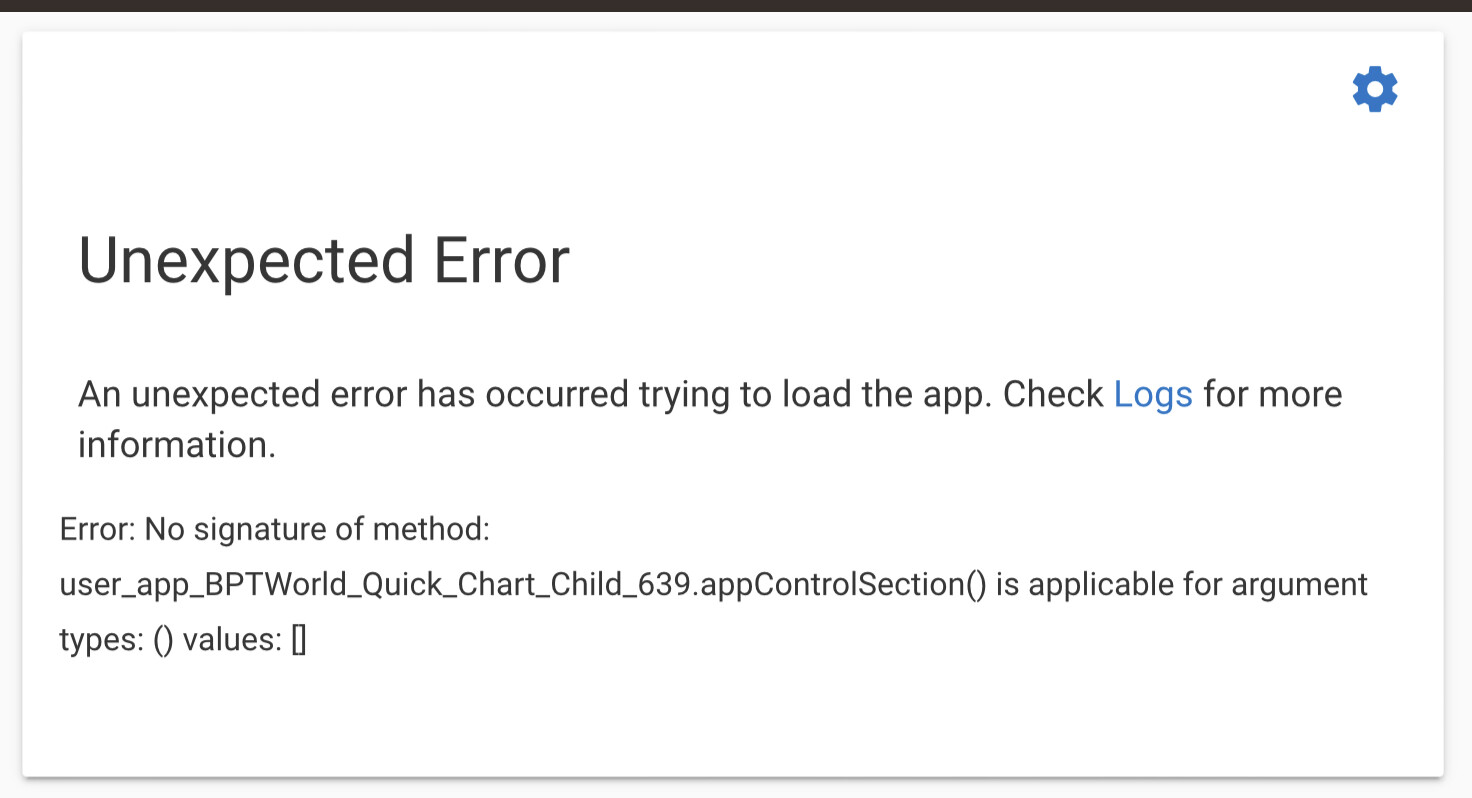
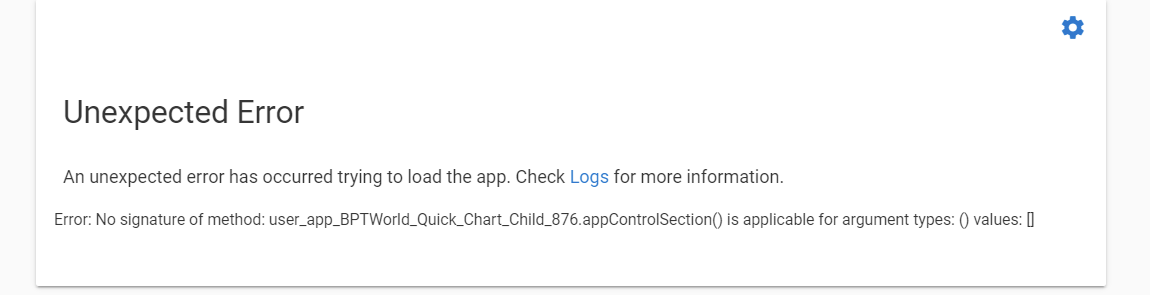
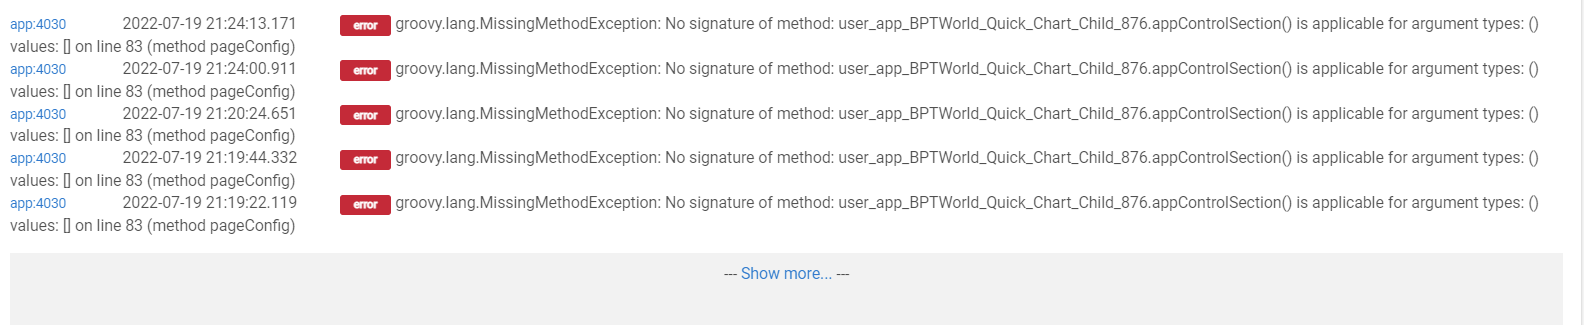
@bptworld - just installed Quick Chart for the first time and when I hit add new quick chart I get an unexpected error. I got the same error when trying data collection also.
Update your Normal Stuff Library
Hi,
After updating the bundle this morning I came back to the dashboard to find this:
I was on v1.1.6. I went ahead and installed Normal Stuff Library again from your Bundle Manager and still got the exact same error. I also confirmed that in the Library code section that I indeed have v1.1.6 installed.
I also removed Quick Chart and added it back fresh to test.
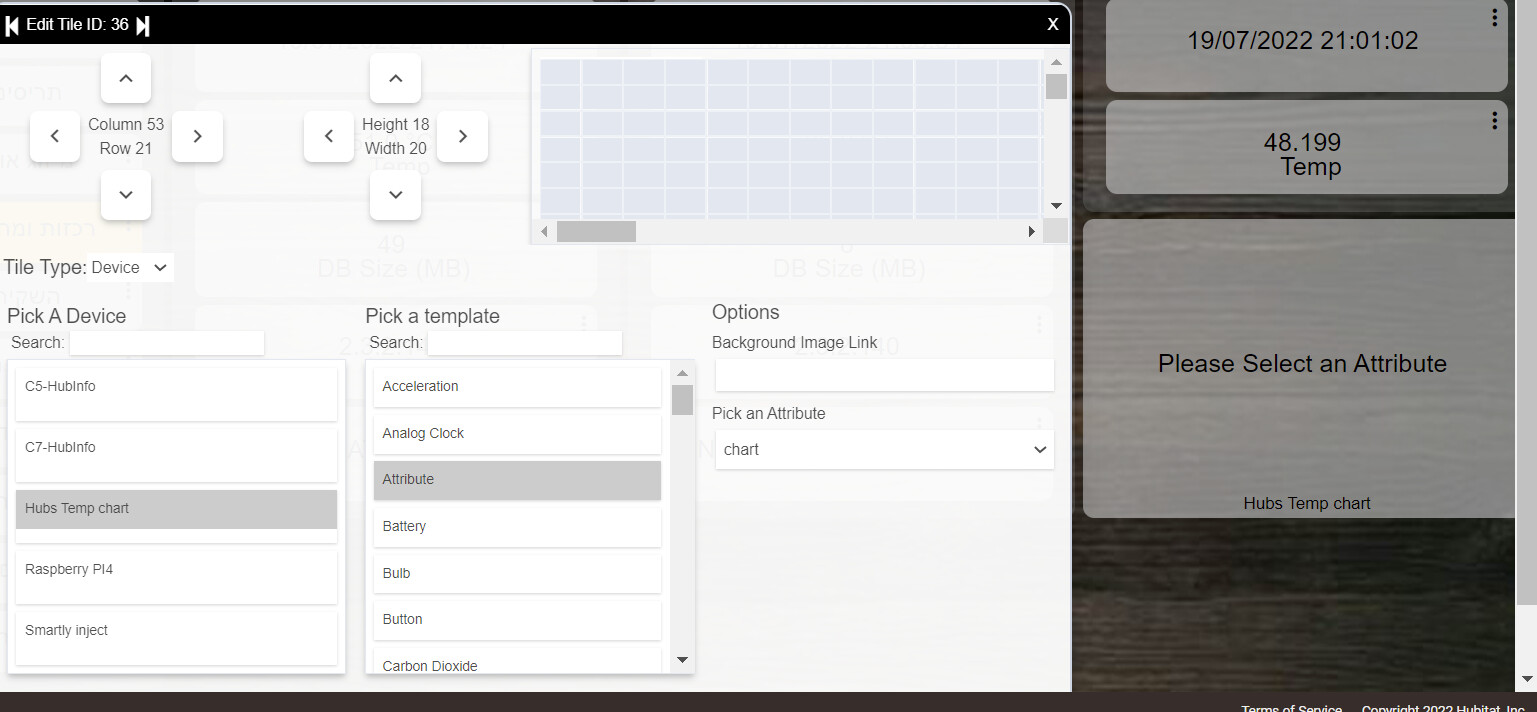
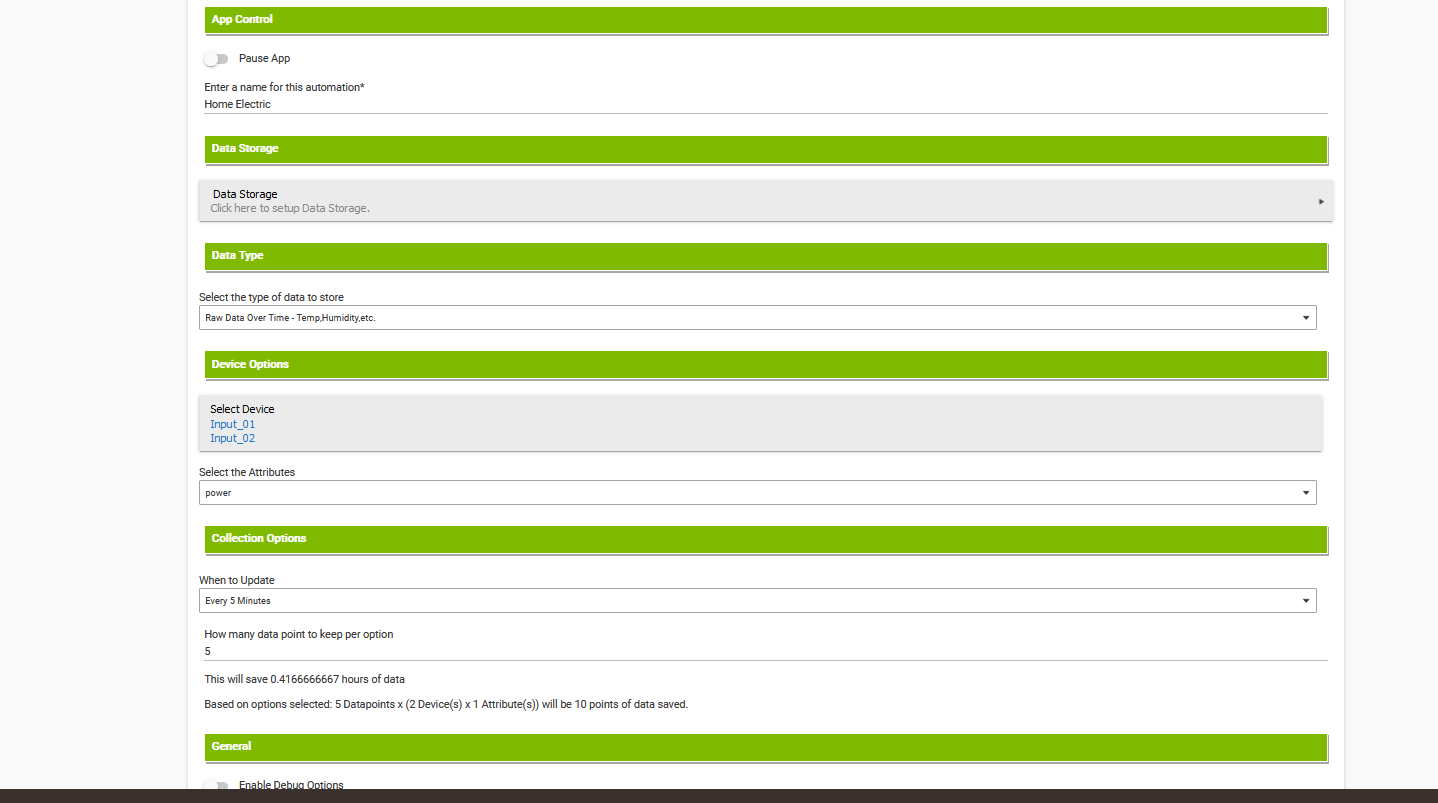
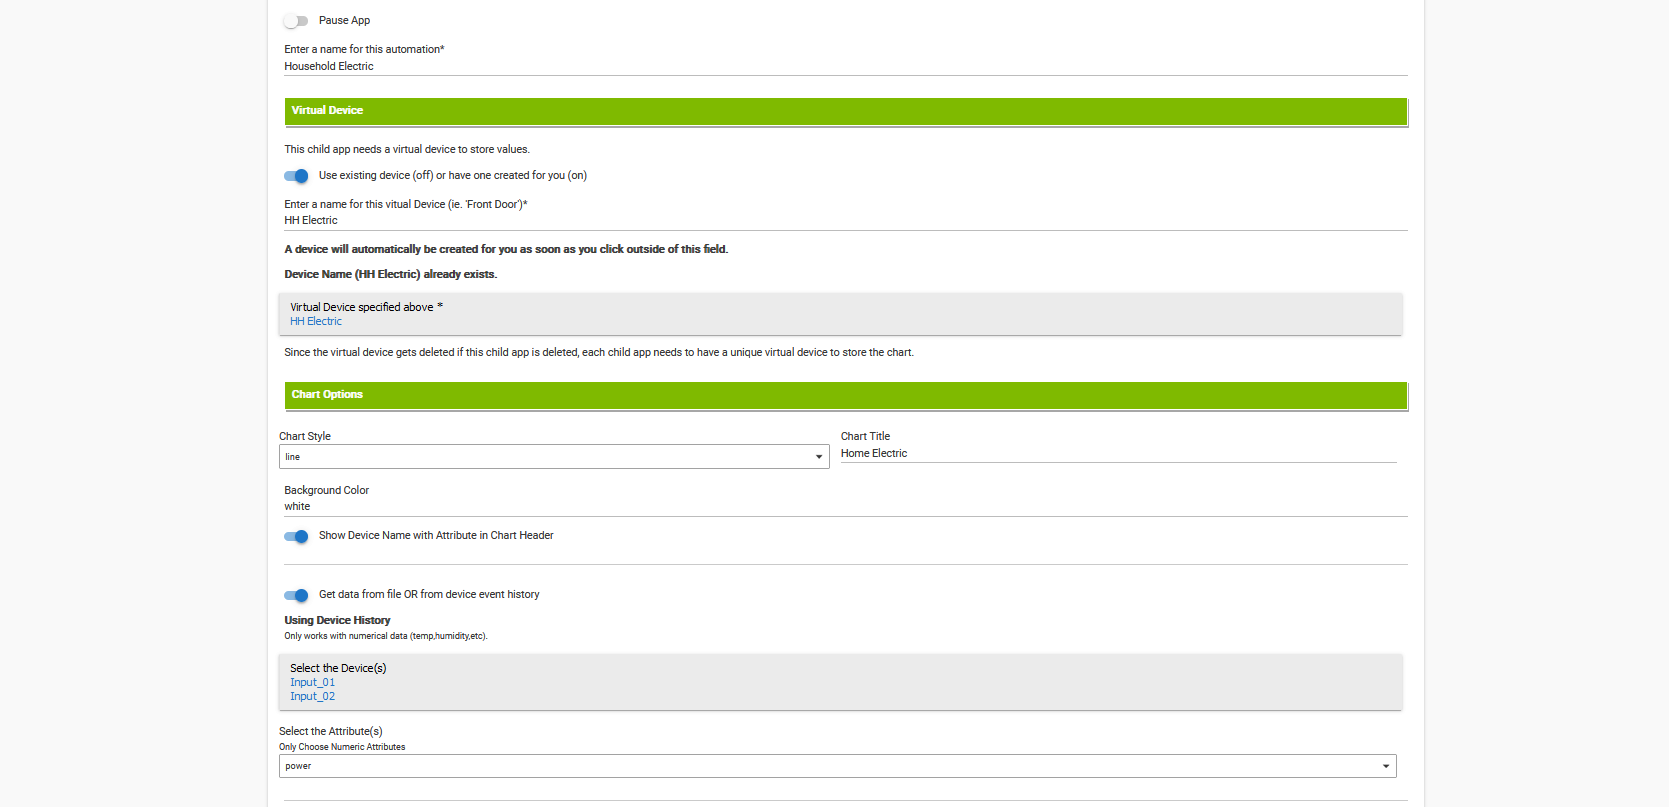
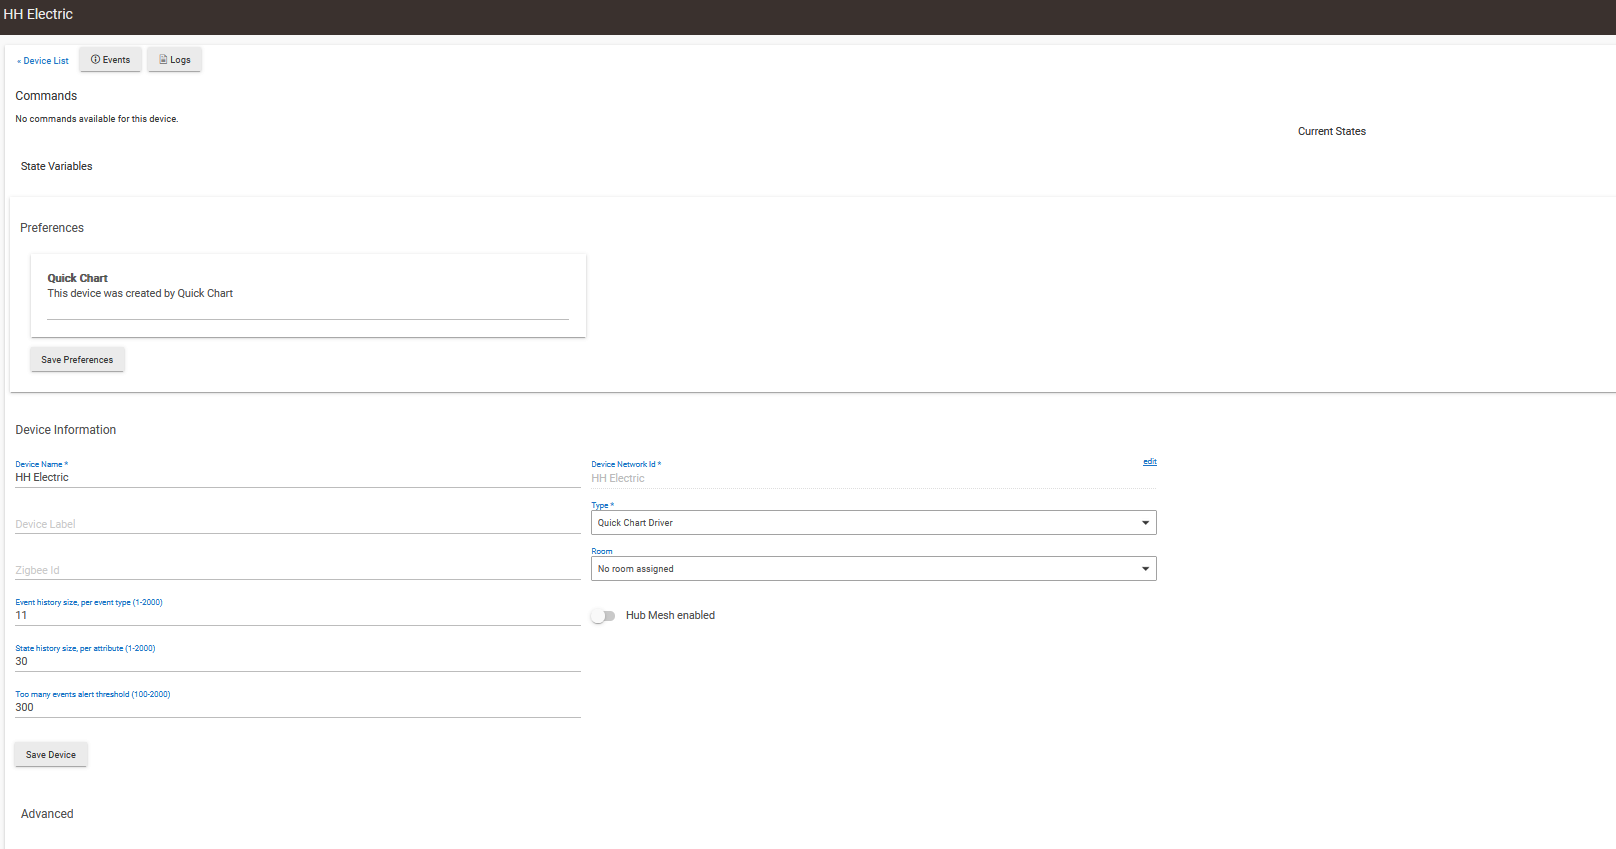
@bptworld Installed this morning and not sure what I'm doing wrong. As you can see there aren't any attributes displayed on the device page 
filename under datastorage=hhelectric
Download the Hubitat app