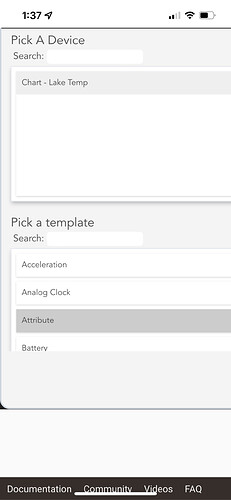
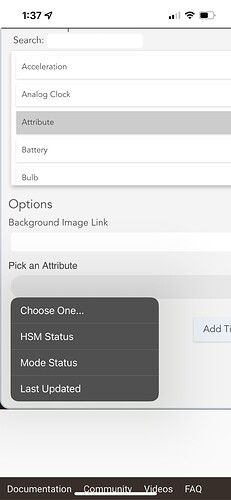
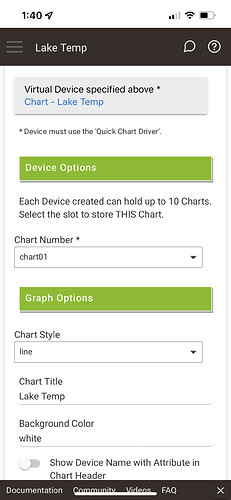
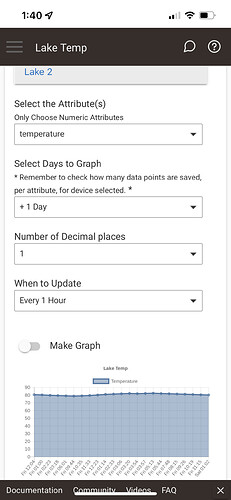
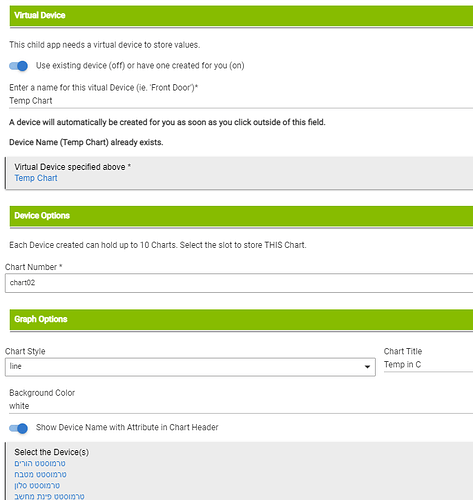
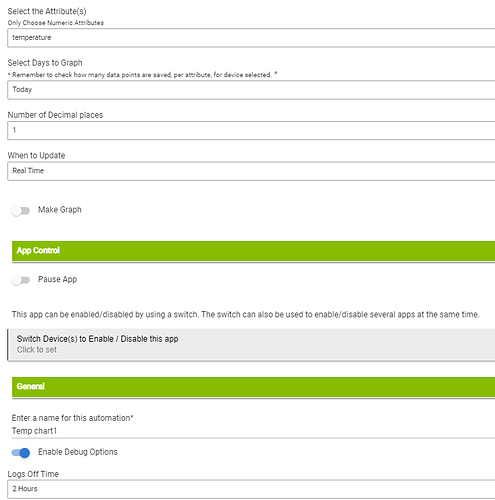
Here's an example of what Maker API returns. I wouldn't need every key/value pair for what I am doing... It's basically an array of json elements (I'm probably not using the right terms there....
Example Data
[{"device_id":"614","label":"Raspberry Pi (Analytics) Temperature","room":"Infrastructure","name":"temperature","value":"47.225","date":"2022-07-16T21:50:59+0000","unit":"\u00b0C","isStateChange":true,"source":"DEVICE"},{"device_id":"614","label":"Raspberry Pi (Analytics) Temperature","room":"Infrastructure","name":"temperature","value":"46.738","date":"2022-07-16T21:48:59+0000","unit":"\u00b0C","isStateChange":true,"source":"DEVICE"},{"device_id":"614","label":"Raspberry Pi (Analytics) Temperature","room":"Infrastructure","name":"temperature","value":"47.712","date":"2022-07-16T21:48:00+0000","unit":"\u00b0C","isStateChange":true,"source":"DEVICE"},{"device_id":"614","label":"Raspberry Pi (Analytics) Temperature","room":"Infrastructure","name":"temperature","value":"46.738","date":"2022-07-16T21:47:00+0000","unit":"\u00b0C","isStateChange":true,"source":"DEVICE"},{"device_id":"614","label":"Raspberry Pi (Analytics) Temperature","room":"Infrastructure","name":"temperature","value":"47.712","date":"2022-07-16T21:44:00+0000","unit":"\u00b0C","isStateChange":true,"source":"DEVICE"},{"device_id":"614","label":"Raspberry Pi (Analytics) Temperature","room":"Infrastructure","name":"temperature","value":"48.199","date":"2022-07-16T21:43:00+0000","unit":"\u00b0C","isStateChange":true,"source":"DEVICE"},{"device_id":"614","label":"Raspberry Pi (Analytics) Temperature","room":"Infrastructure","name":"temperature","value":"46.738","date":"2022-07-16T21:41:59+0000","unit":"\u00b0C","isStateChange":true,"source":"DEVICE"},{"device_id":"614","label":"Raspberry Pi (Analytics) Temperature","room":"Infrastructure","name":"temperature","value":"47.712","date":"2022-07-16T21:40:59+0000","unit":"\u00b0C","isStateChange":true,"source":"DEVICE"},{"device_id":"614","label":"Raspberry Pi (Analytics) Temperature","room":"Infrastructure","name":"temperature","value":"47.225","date":"2022-07-16T21:39:59+0000","unit":"\u00b0C","isStateChange":true,"source":"DEVICE"},{"device_id":"614","label":"Raspberry Pi (Analytics) Temperature","room":"Infrastructure","name":"temperature","value":"46.738","date":"2022-07-16T21:38:59+0000","unit":"\u00b0C","isStateChange":true,"source":"DEVICE"},{"device_id":"614","label":"Raspberry Pi (Analytics) Temperature","room":"Infrastructure","name":"temperature","value":"47.225","date":"2022-07-16T21:38:00+0000","unit":"\u00b0C","isStateChange":true,"source":"DEVICE"},{"device_id":"614","label":"Raspberry Pi (Analytics) Temperature","room":"Infrastructure","name":"temperature","value":"45.764","date":"2022-07-16T21:36:00+0000","unit":"\u00b0C","isStateChange":true,"source":"DEVICE"},{"device_id":"614","label":"Raspberry Pi (Analytics) Temperature","room":"Infrastructure","name":"temperature","value":"47.225","date":"2022-07-16T21:35:00+0000","unit":"\u00b0C","isStateChange":true,"source":"DEVICE"},{"device_id":"614","label":"Raspberry Pi (Analytics) Temperature","room":"Infrastructure","name":"temperature","value":"46.738","date":"2022-07-16T21:34:00+0000","unit":"\u00b0C","isStateChange":true,"source":"DEVICE"},{"device_id":"614","label":"Raspberry Pi (Analytics) Temperature","room":"Infrastructure","name":"temperature","value":"47.225","date":"2022-07-16T21:33:00+0000","unit":"\u00b0C","isStateChange":true,"source":"DEVICE"},{"device_id":"614","label":"Raspberry Pi (Analytics) Temperature","room":"Infrastructure","name":"temperature","value":"46.738","date":"2022-07-16T21:31:59+0000","unit":"\u00b0C","isStateChange":true,"source":"DEVICE"},{"device_id":"614","label":"Raspberry Pi (Analytics) Temperature","room":"Infrastructure","name":"temperature","value":"47.225","date":"2022-07-16T21:30:59+0000","unit":"\u00b0C","isStateChange":true,"source":"DEVICE"},{"device_id":"614","label":"Raspberry Pi (Analytics) Temperature","room":"Infrastructure","name":"temperature","value":"47.712","date":"2022-07-16T21:29:59+0000","unit":"\u00b0C","isStateChange":true,"source":"DEVICE"},{"device_id":"614","label":"Raspberry Pi (Analytics) Temperature","room":"Infrastructure","name":"temperature","value":"46.738","date":"2022-07-16T21:29:00+0000","unit":"\u00b0C","isStateChange":true,"source":"DEVICE"},{"device_id":"614","label":"Raspberry Pi (Analytics) Temperature","room":"Infrastructure","name":"temperature","value":"45.764","date":"2022-07-16T21:28:00+0000","unit":"\u00b0C","isStateChange":true,"source":"DEVICE"}]
