You can try to monitor your Aqara E1 TRV performance with a time graph like this :
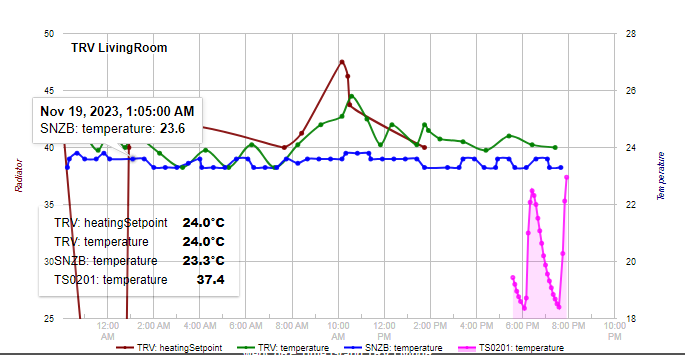
(the graph looks messy w/ some spikes because of the tests I have made today )
The blue line is the external sensor temperature readings - it is placed about 4 meters away from the radiator. The temperature differs by less than 0.8 degrees during the day.
The pink-colored line (left axis) is the temperature measured by another external sensor placed on top of the radiator (where the hot water comes in). It actually shows when the TRV valve is open, as the Aqara E1 does not report back the valve position - a big disadvantage for my graphs .. : (
But the Aqara E1 inbuilt PID control algorithm works just fine in my use case.
Edit: Aqara E1 thermostat driver is now available for tests :

