I'll keep my mouth shut
2 Likes
- Develop the native graphing feature.
Plenty of posts of stuff that does not work, needs attention, could be improved, etc...
- Finish the native Bond Bridge integration. It was released a few years ago to much fanfare and then nothing...
6 Likes
Funny you mentioned this. The latest update introduced the first basic graph in the web interface. Check out the new built-in automation:
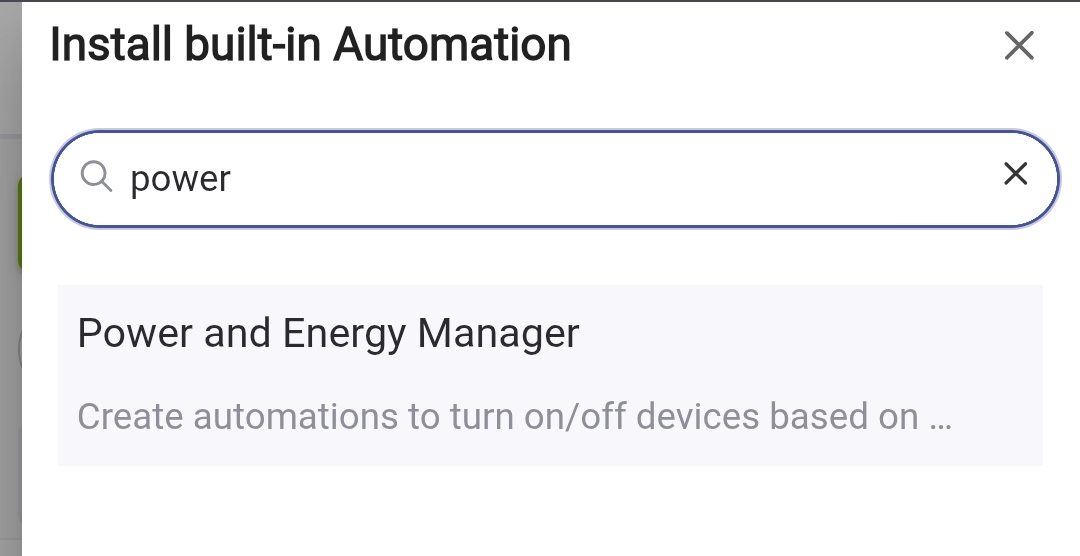
What data would you like to see available for future graphs?
1 Like
What would you like to see added to the Bond integration?
1 Like
Make it so that when you filter a log to find something...and then you go to that entry...you are able to undo the filter and see everything around that entry.... without returning to the top to clear the filter ...and then having to scroll all the way back down to it.. That is a bit clunky with today's interface.
5 Likes
Temperature and humidity are easy ones off the top of my head. Really anything with a value could be useful. Color temperature and level may not be that useful, but it would be interesting to see it vary with circadian apps.
Is it possible to do graphs programmatically? Select your device and then select the value you want to watch. Similar to how you select custom functions on a device.
1 Like
Voltage
Temperature
Humidity
Generic values, other devices or variables
1 Like
My vote would be for native ESPHome capabilities. The community version isn't well supported (the guy who built it doesn't use Hubitat anymore) and can't utilize the native ESPHome security due to Hubitat sandbox limitations.
5 Likes
A couple ideas:
- The Z-Wave firmware updater has issues with battery powered devices. Handshaking and starting of download is prone to be hit or miss. Once update starts it generally finishes but can be overly fussy getting the wake up on the device to mesh with HE firmware updater polling routine. Even a simple thing like a prompt line to say device not responding (to initial firmware query) and "needs to be woken up" by user would be helpful.
- Remote Access Platform software update sometimes fails and can even lock up HE. Power cycle HE returns it to prior rev and is ok but didn't get update. Many folks can't power cycle HE remotely. When you don't bring up GUI and run the software update from the remote access web page, updates work reliably. So something about bringing up the GUI and launching the update from there that is bogging down.
- Better RM editing tools. When your rules get longer the tools are clunky for editing them. You can do what you need to but it seems it could be more streamlined. Especially so when you are using multi tiered command like setLED which has so many steps to create.
- Ability to do more variable math in rules. Allow users to create simple equations to manipulate data from sensors and variables. Also would be nice to reformat sensor data easily to round fraction, show fixed number of decimal places, add or not add commas (for values >1,000), ....
- Add a tick box to the "Append to %filename%" action in rule machine. Ticked means add a mandatory CR after the data (that particular record appended to the file), unticked, don't.
- GUI based pairing of ZWave LR. I just find smart start more trouble than it is worth. I'd rather just pair LR devices the old way via the add device tab from the GUI.
- Add an ability to reboot the ZWave engine without powering down (or rebooting) the platform. So many posts here say ZWave is locked up you must power off HE for 30 seconds to reset ZWave chip. Surely there is a less obtrusive way?
Yes that would be handy - just having the top part of the screen where the filter is freeze would allow that.
1 Like
Would it be too resource intensive to include some performance metrics for each log entry?
If available, I would like to see CPU usage, Disk IO, and total latency. I know some of these are available in aggregate for each app in another area of the log but having them in more detail and more “readily available” right in the log entries would help for more awareness and be helpful.
Great job on the new version release. I personally like the new layout. I do admit it took a few minutes to adjust to. I spend most of my time in the “automation” type activities. Now I have a much more abbreviated list to navigate up and down.
- Don
1 Like
I really would just like dark mode.
10 Likes
In EZ dashboard, I have several graphs. The issues to date include (but are not limited to)
- I'd like to visually see when the dehumidifier is on or off. However, in Tile Type, I can only select light or switch; graph is not an option. I'd like it to be.
- I'm monitoring multiple temp/humidity sensors, and the graphs are vertically stacked in the dashboard. However, since each sensor is a different type of device, they report at different intervals which results in different timelines on the graphing. This results in one reporting back to 4/20, another 4/26, and one 4/27. I'd like the ability to set the horizontal timeline limits for the reporting, so I can visually compare them.
- While we are at it, I'd like the ability to set the vertical limits on the graph as well.
- I'm using alot of screen real estate. If there were a way to either
a. Insert data from multiple (at least 4) devices on one graph, with each being a different color (would need a legend) that would help.
b. Insert more than one data type from the same device onto one graph (ie temp and humidity) that would also help, but not as much as 4a. - There is alot of space in the graph. Ability to display the current value of the device in the upper right corner (move the legend left) would eliminate needing to add another tile to display current value.
- Please see this post from about 1 year ago: [FEEDBACK] Easy Dashboard feature request and feedback - #73 by calinatl
The above is just a start...
1 Like
-
See this post - ability to remove a device - @bcopeland seemed to think it was something to be fixed, but that was 3 years ago...
Bond Integration built-in app. How to remove device? - #26 by pocket_geek -
See this post - allow Bond Ceiling Fans to work in EZ dashboards.
EZ (or Easy?) Dashboard and Bond Bridge Devices
Light works, fan does not. -
I'd like the native Bond app to have similar capabilities to the community Bond App. I don't recall right now what the specific differences are, I just know I have to use both )-:
Again, just a start.
+1
EZ dashboards, cant use them right now, missing to many things, but if...
- More attributes to work with them; Voltage, Variables, etc..
- Ability to change tile font; size, color, bold, etc. They grey font is to light..
- Option for tile text to wrap..
- The color picker is not possible to match tiles.. Have a selection of already picked colors to select from. Or at least a HEX input.
- The ICON position seems to be in different places. Ability to say where the ICON goes; top, side, etc..
- Tiles change color with state or value for numerical attributes, selectable color/icon.
Still EZ but lot more Advanced features to make it usable for more then basic devices..
1 Like
Thumbs up to that!!
1 Like
Plus one for ESPHome — or at least being able to access the bits needed to get Noise encryption behaving like a good citizen.
I sunk a lot of time into the integration, focused on the pieces I needed for proper native control. Built up the confidence, refactored the code, stitched everything together…
…and then absolutely face‑planted because the sandbox decided “no cyphers for you”. ![]()
I had some thoughts on the Bond Integration in this thread.
There currently seem to be a few errors and, possibly, limited support for my "dimmable light controller". Addressing those would be huge for me. ![]()
Also, enabling "Command Retry" would be nice.
My current workaround was to create a virtual dimmer--then write a routine to sync up the real Bond Integration light with it (looping until it gets set).
Thx

