You might want to contact support to see if they have any suggestions.
Tagging @gopher.ny
You might want to contact support to see if they have any suggestions.
Tagging @gopher.ny
If I remember right... after adjusting limits.. error still stays there. Then if you click alert button it does not open configuration page anymore like it is supposed to do if error is still existing. That is what happened here and I decided to wait if error disappears and it was gone next day.
I suppose if nothing else, it prompted me to do a little house keeping. My logs have never looked cleaner!
Just checked your hub, the database is growing, and fast. This is not normal.
Please take and download a local backup from Settings - Backup and restore and do a soft reset, followed by a restore from the backup.
@gopher.ny But, I do not see any effects whatsoever of this.
Hmm, ok... Let's try this.
/hub/advanced/event/limit/11
/hub/advanced/deviceStateHistorySize/11
/hub/cleanupDatabase
@gopher.ny I had previously set both event limit and state history to 10. However, I did perform the database cleanup which lasted only seconds and actually complete shutdown the hub, disconnected power and left powered down for a few minutes.
When it came back online, it doesn't seem to have any errors, my logs are normal and the runtime stats are normal from my devices/apps.
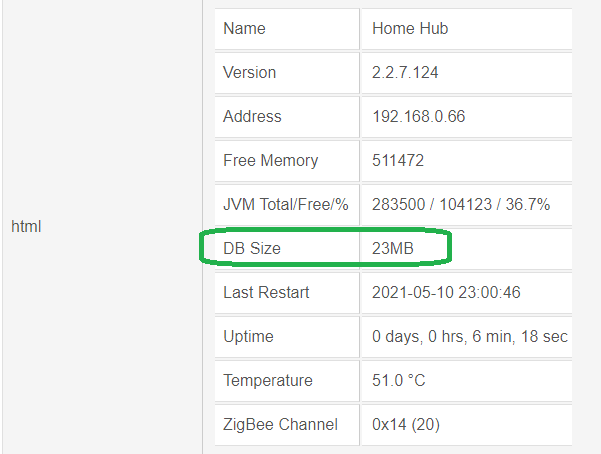
I just checked and the database alert returns:
Setting it at 10 and under triggers immediate history truncate as soon as new value is inserted, for both states and events. Setting it at 11 means hourly cleanups (as opposed to immediate). Let's see how it fares.
@gopher.ny It seems to be holding at 190m for the past 5 mins. I was, obviously, unaware that the event limit/state history had other functionality aside from capping the amount of data. If you think it would be best to set them at '11' rather than '10' please let me know and I can repeat the process.
Thanks,
Stephen
Just set the value to 11, no need to reboot right away. It should, at a minimum, stabilize things.
Done, it seems to be holding at 190m
@gopher.ny Now the alert just went away...
It's down to 29m and change, according to the support tool.
@gopher.ny Thanks for your help!! 

Seems to be stable now, so far as that alert popping up. Other than that, I still see no change in operation. Nevertheless, its obviously cleaner than before this incident.
thanks for the help
@gopher.ny Thank you very much! 
Your advice helped me as well! My database was 2 GB!
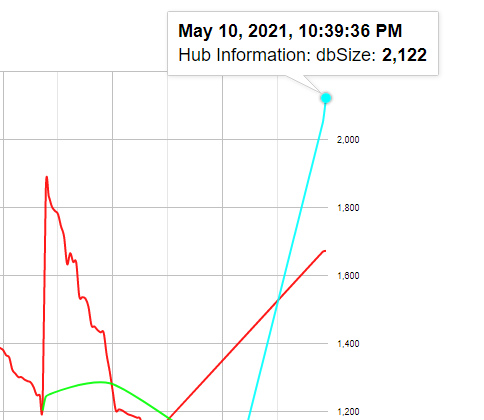
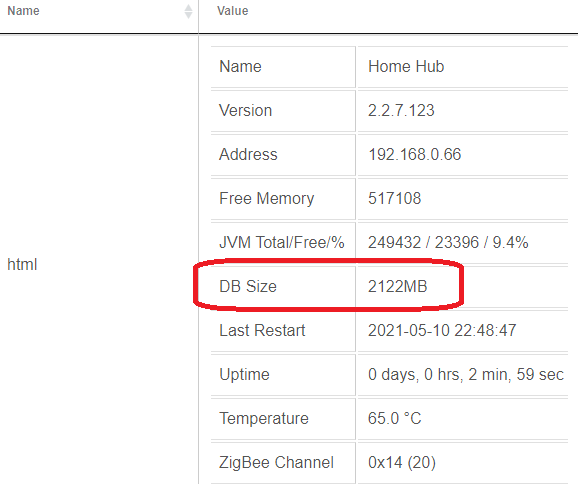
Now it is :
I still have to find what is causing my hub to grow the database to such an enormous huge size, but at least I know now how to fix it temporarily,,.
Thank you again!
Спасибо!
A follow-up a few days later...
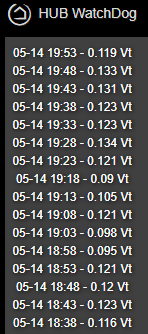
My system is stable now, no noticeable delays, HUB Watchdog values are not so bad:
BUT:
My C7 hub database size grows very quickly from 13MB after the reboot up to 90-100MB for less than an hour. Then it stabilizes and varies between 80..90MB :
So something strange happens, filling up the database extremely quickly in my opinion:
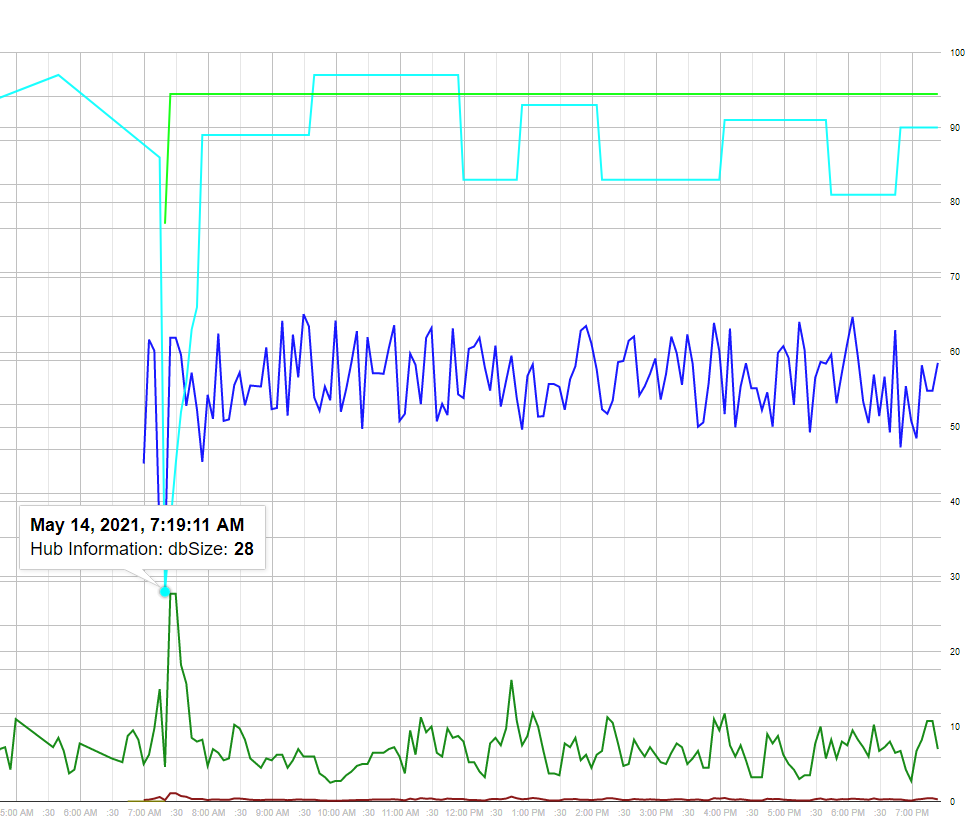
7:19 - 28 MB
7:24 - 37 MB = 1.8 MB/min = 30 KB/sec dB size increase
7:29 - 45 MB = 1.6 MB/min = 26 KB/sec dB size increase
7:34 - 52 MB = 1.4 MB/min = 23 KB/sec dB size increase
7:39 - 56 MB = 0.8 MB/min = 13 KB/sec dB size increase
7:44 - 63 MB = 1.4 MB/min = 23 KB/sec dB size increase
7:49 - 66 MB = 0.6 MB/min = 10 KB/sec dB size increase
7:54 - 89 MB = 4.6 MB/min = 76 KB/sec dB size increase
10..70 Kilobytes per second growth of the database is very unlikely to be due to Events to States recordings... nor logs. Should be something else that I don't understand.
I have spent too much time in the past days trying to narrow down the possible reasons. I went a wrong path disabling 'chatty' devices such us my NEO Coolcam power plugs, disabling/deleting applications that were on the top op the App stats State size (such a hubigraphs, weather tiles, etc..), disabling cummunity/custom integrations, etc.. All this was a waste of time, as it is obvious that no driver or app can generate nearly 2 Megabytes of events / states data per 1 minute!
I did a Soft Reset. I restored different database backups from the last week, I performed a lot of ..IP/hub/cleanupDatabase procedures. Currently, I have Event History Size = 1 and State History Size = 5. I am sure that even if I increase the sizes to 50 or 100, the database will not grow up so much compared to the 90-100MB that I have now. The database seems to be filled up with something else...
The only other thing that I am going to try is to exclude two Z-wave devices that are not powered on, but exist as nodes in the network.
As I said, I have no performance issues in the last 2 days. But what remains is the doubt that something is not OK.
I see similar numbers to you.
You likely want to set the minimum states/events to 11, as anything less than that causes the db to try to clean up each time (wastes time).
I do agree and see in my observations the db growing quickly. So something is changing it a lot, but I don't see it in any of my devices....I'm guessing there is a problem on something internal pounding the db that needs to be fixed.
For me I observed this with the 2.2.6 releases.
As an FYI, I have hub mesh turned off (or at least at settings I do).
Don't get hung up on database size too much. It gets compacted/defragmented on alternate shutdowns, grows quickly after a boot, and stabilizes at some point. The database engine handles it, and while it's not entirely a black box, the number of buttons we can touch is limited.
I'll probably increase the alert threshold, though.
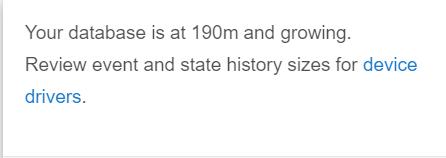
Well this is wild, I guess I'm jumping on this train. My database typically hovers around 75mb, I login today and see 1.6GB... About 20 minutes ago, it was 1.55GB (1550mb). So it's grown 57mb in about 20 minutes. In the 5 or 10 minutes I've been typing this, it's grown another 10mb.
![]()
The app stats and device stats pages don't show anything crazy and I don't actually have any devices that generate a lot of unique frequently updating attributes.
The only change I've had in the past couple of days is the addition of a Zwave (S0) lock.
@gopher.ny I know you said not to be hung up on it (and I typically do prescribe to the "if nothing is broken, don't worry about it"), but I'm curious if there is any sort of backend DB logging/activity around zwave devices, that might not show up in the device/app stats. My zwave mesh was having some issues post inclusion of this device and so I'm wondering if maybe somehow it's pounding away at the DB and causing it to grow quickly.
Glad I saw this. I had mine set to 1 and things became quicker after setting them to 11. I’m wondering if this was causing my Zigbee lockups. I’ve been using Apple’s Adaptive Lighting, which sends quite a few Zigbee commands all at once. Having the hub constantly cleaning this up was probably less than ideal.
Download the Hubitat app