The "clean up immediately" logic is going away in the 2.2.8. It's caused nothing but trouble.
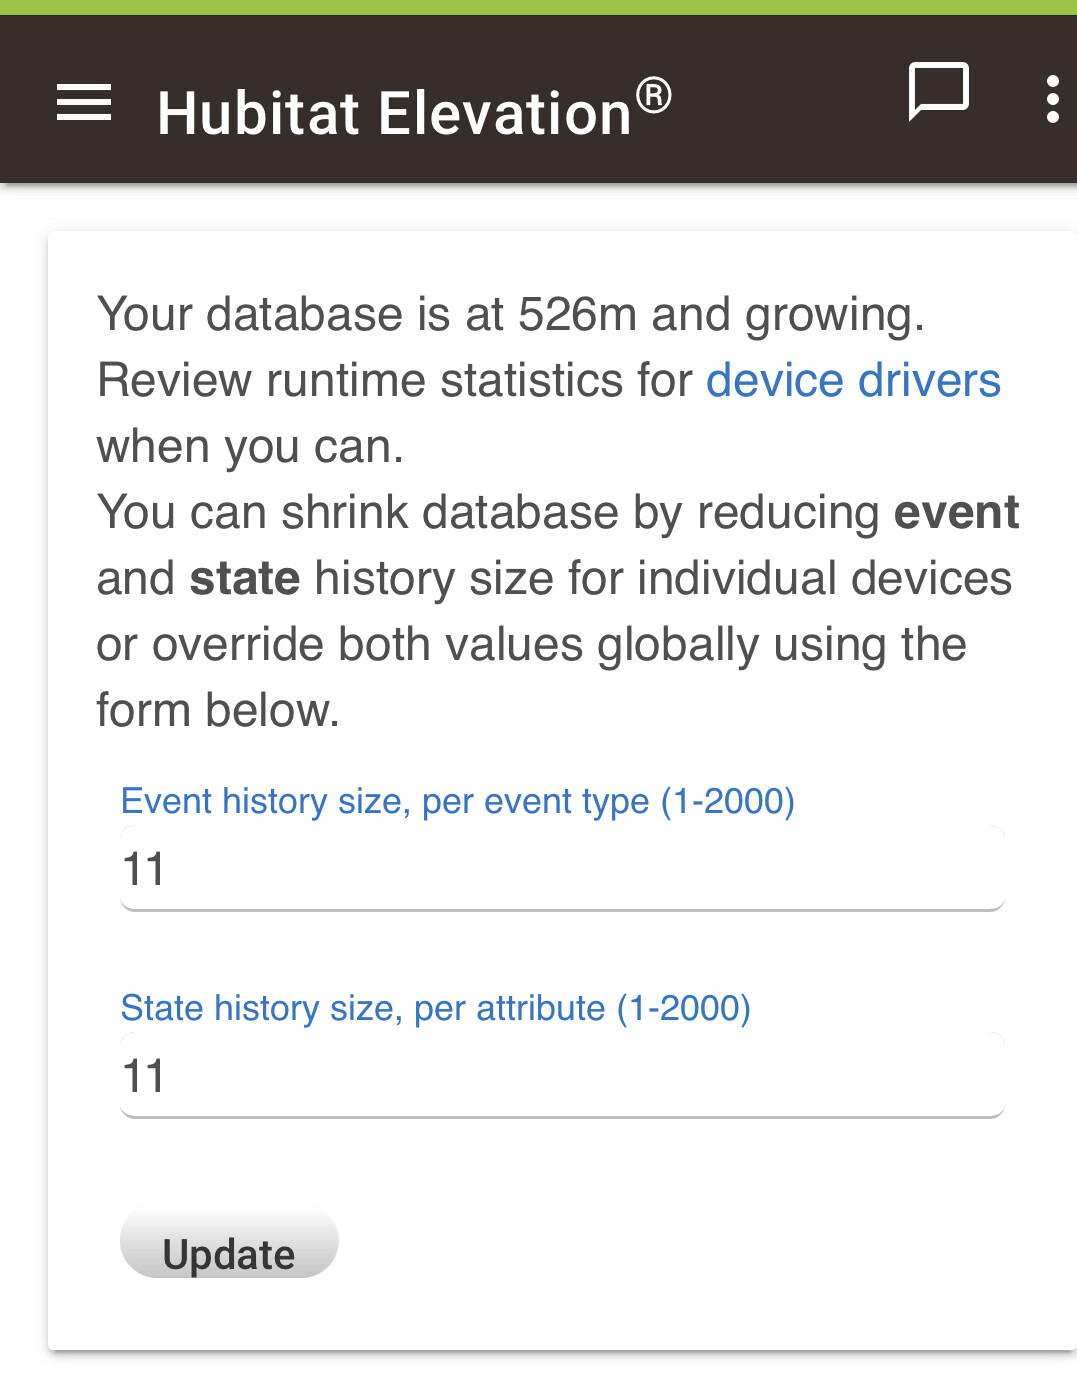
Edit: to be clear, it gets triggered only for devices' max state/event counts of 10 or less. Setting these values to 11 or more means hub will do regular hourly cleanup. Default values do not trigger this logic.
Yeah post reboot, still seeing the overflow. Will give it a soft reset. For reference, things seem to be working, but I imagine I'll run out of disk space soon enough, given the growth.
Yeah, and then main process will crash. It's a recoverable situation, since diagnostic tool will still be functional, but a proactive approach is best.
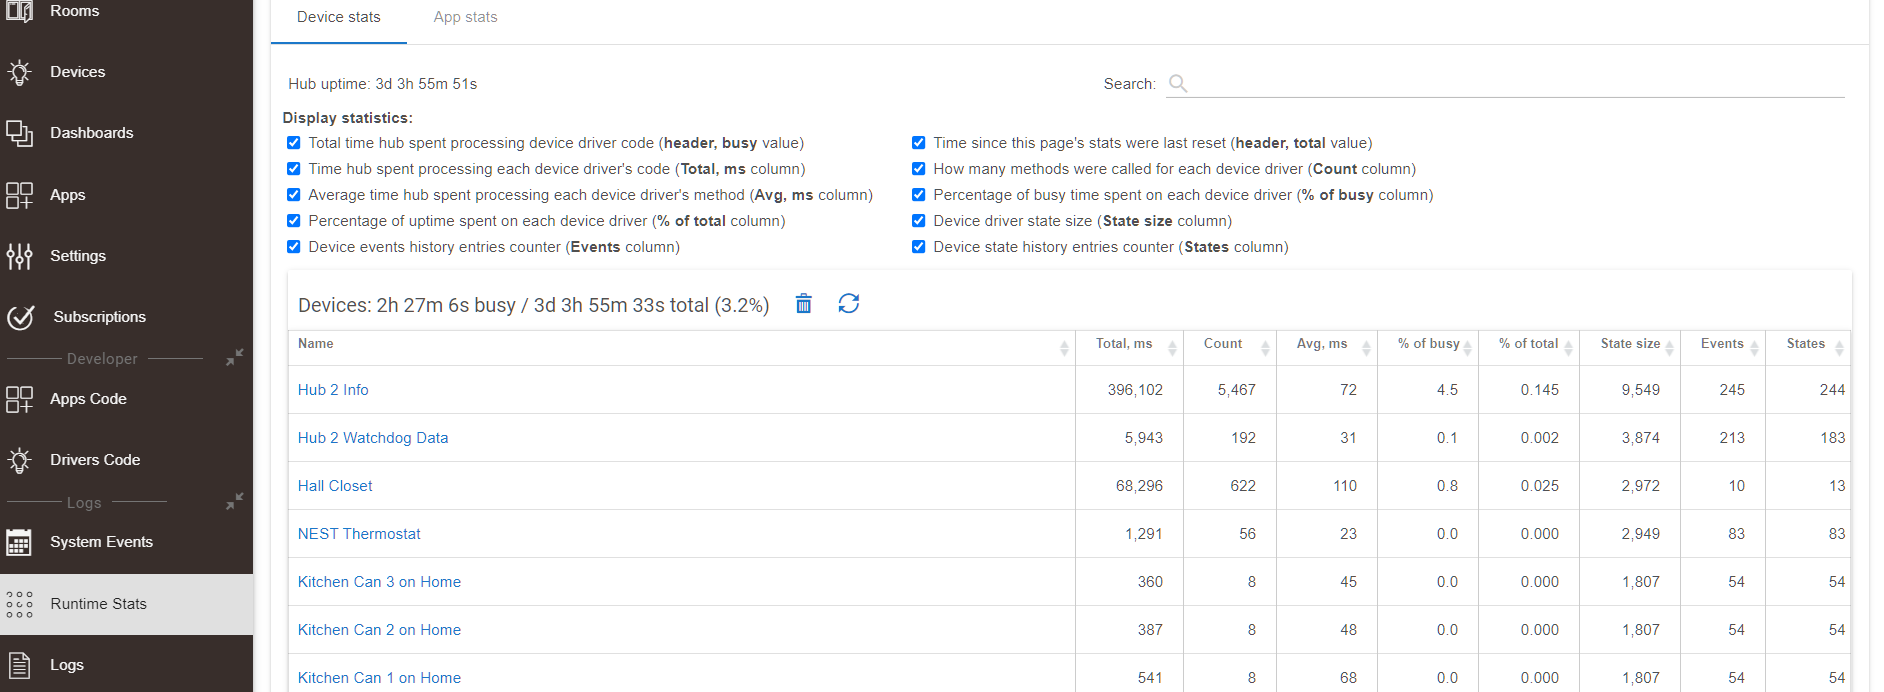
I've reset and restored. Down to a nice 9mb.. I'll keep an eye on it, to see if the condition returns. I've started graphing this data, so much easier to track now.
could we have these permantly available in the UI in future releases?
maybe with a note
i have been setting these to 5 and 10 thinking its better, but had noticed the hub CPU5min had been going up but didnt know by change the value it would be triggering instant clean ups
Yes. This started with 2.2.6, which explains why I started seeing performance issues with the first 2.2.6 release. I was having cpu usage spikes of near 100% with mine both set to 1. Since changing both to 11, no problems. @gopher.ny I haven't had anymore cpu usage spikes or zigbee lockups since changing these to 11. It seems likely that continuous CT changes to 26 of my zigbee bulbs via Apple's Adaptive Lighting was hammering the processor due to the continuous cleanups that insued. I haven't changed my use of Adaptive Lighting, or anything else except setting the event and state histories to 11 from 1. I wish this had been elaborated on in the release notes
Im seeing really similar stuff. My database seems to grow by leaps and bounds every time I check it. I have used the commands to trim events to 11 and prune the database. Here’s what I’m seeing... i
It’s likely a device or app not behaving with the latest firmware. I had this issue where I woke up to my db being 310MB, when it’s never been greater than 40. It was my Hub Watchdog data driver. I deleted the data device and reinstalled and it hasn’t happened since.
Yeah I did that yesterday and nothing seemed to have jumped out. However I followed the soft reset instructions and DB size seems to have stabilized around 40mb down from 550mb and climbing yesterday. So whatever was causing the runaway Growth seems to have stopped. I'm building a dashboard of critical stats so I can keep an eye on it.