HPM supports "file manager files" but for some reason, html files get "interpreted" during import. I took an hour or so over the weekend to get that far.. but I need to open up some more time to investigate beyond...
9 Likes
Any love for my geriatric C5 with this tool?
It works on the C-3 like charm; should do fine for any hub that supports dumping getChildandRouteInfo (so far they all do)
4 Likes
I have been running this all day and I know the ones I see dropped are direct from the Hub, some are repeaters that don't get an end-device connected to it.
Anyone else seeing devices appear and then getting removed from the graph sometime later?
I see this as well. This will happen when a device gets bumped out of the neighbor table (it's normal; neighbor table capacity is only 16 so if the table's full, routers with weaker links can get evicted to make room for others that have better connections at the time).
Updated the file with the following change:
- Integrate zigbee logs into the graph (@jonathanb)
Thanks to @csteele, this is now also available on HPM:
- Install app via HPM (search for "zigbee-graph")
- Go to
"Apps", click"Add User App", then select"Zigbee Graph"(it should be on the list) - Click
"Done"(this step will download the"zigbee-graph.html"from GitHub) - Once installed, go to
"Apps", and select"Zigbee Graph"from the list, then click the"Show zigbee graph"link
Have fun!
17 Likes
This is a great addition!
Hubitat community implementation is now becoming even better than the Zigbee2MQTT map! ![]()
9 Likes
Great update! Install from HPM went perfectly on my C5.
4 Likes
When there are few chatty Tuya mmWave radars on the map, the fun gets even bigger! : )
2 Likes
Suggestion: update the 1st post with this information.
9 Likes
Another idea:
If the thickness of the line can be changed, could it be set so that the thicker the line, the better the quality of the signal?
Version 1.2.0 change log:
Added
- click a node to go to that device edit page; right-click to release after drag fix (@sburke781)
- show the total number of zigbee devices in status (@Kulfsson)
- add
?embed=trueURL parameter to hide controls (for @thebearmay's dashboard iframe)
Changed
- make app interface friendlier (more groovy copy-paste from HPM code)
- you can download the latest version of
"zigbee-graph.html"from GitHub directly in the app interface
Have fun!
12 Likes
Very nice!
Is there a significance to the pulsing nodes? And some have a lighter dot inside, does this mean somethings?
The graph is now listening to zigbee messages that the hub receives (same information you can find in the /hub/zigbeeLogs page in the UI).
- a node pulses when such a message is received from that particular device; if you hover it, you can see the message details
- a node has a dot inside it if we received at least one such message; nodes without dots inside them are not very chatty within the zigbee mesh.
6 Likes
Neat feature - helped me discover my Aqara no-neutral switch sends something every 10 seconds ![]()
Would it make sense to list those nodes you do get logs for but don't have a route for, say as a column on the right side, disconnected from the graph?
When my nodes are updating in some cases as new ones appear they seem to want to "run away" and start moving away from the general center of my diagram and I have to chase after them w/my mouse to fix their position. Doesn't seem to happen w/all nodes. Just curious if this "run away, run away" (apologies to Monty Python) effect is communicating anything about the nodes, or ?
This tool you've created is pretty amazing. Thanks again.
4 Likes
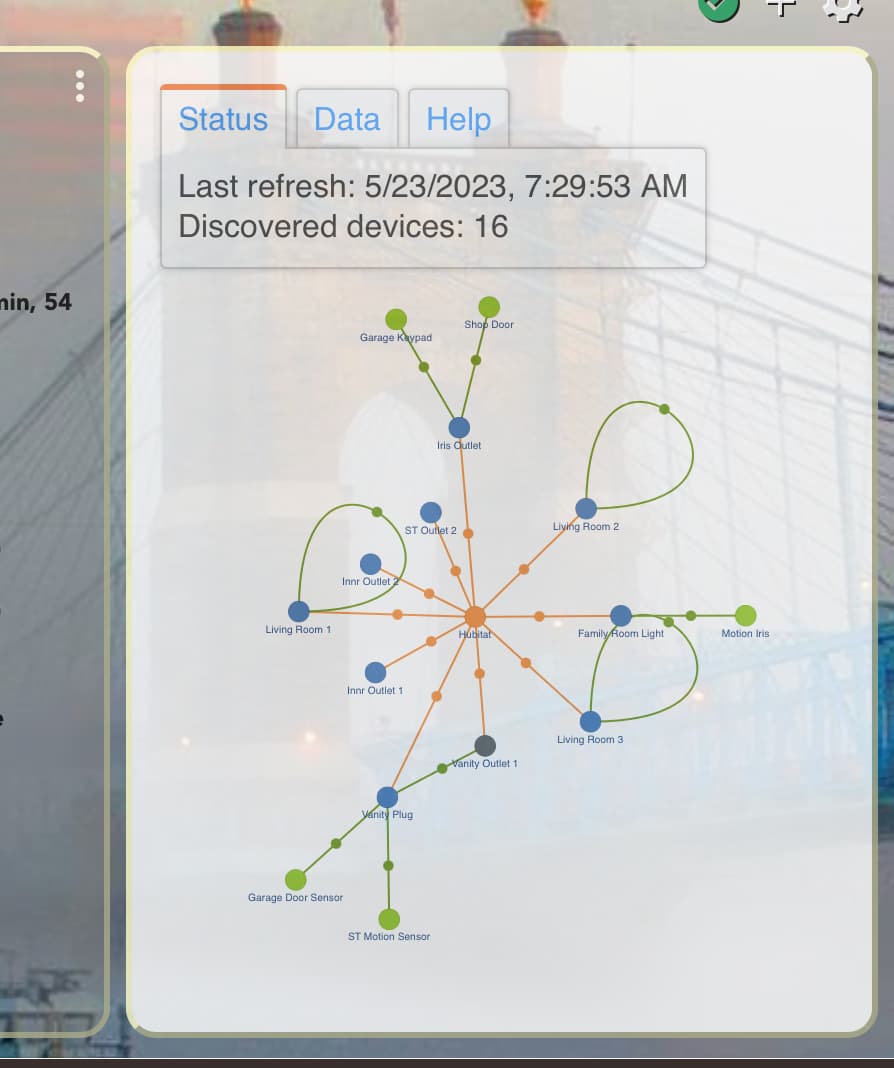
Are these nodes connected to the other nodes and finally to the hub, or are they single / forming their own "clusters"?
Nodes hate each-other and want to stay apart (something like positively-charged protons that are fiercely repelling one another); they are held together by "stretchy" links. You can play with the force-graph behavior here (where you can create nodes and links and see how they arrange themselves):
Of course now that you ask I can't get it to happen...sheesh. I think they were mostly individual nodes connecting back to the hub or a repeater. In some cases I'd have two of them "running together."
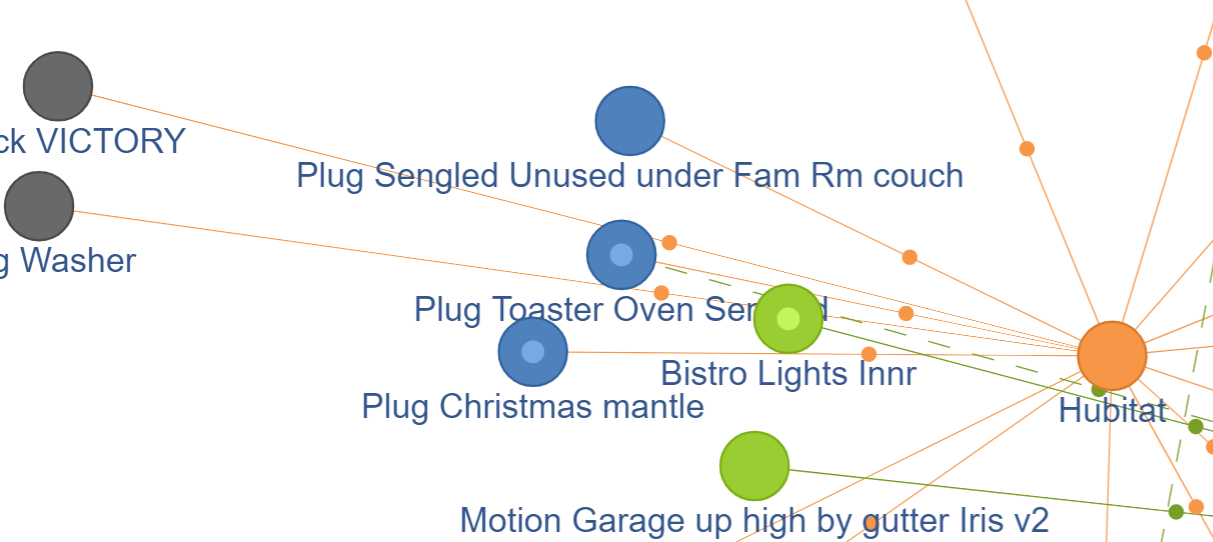
Just happened...what it looks like below - the plug washer and xstick victory appear and then start moving out away from the general center of the graph. They aren't always the dark grey color.
Cool link, thanks. Now I'll be playing "chase the protons" all day. 
6 Likes
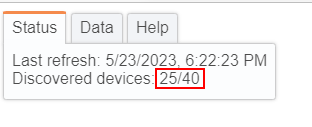
Great! But perhaps it is a case of "Beware what you wish for" for me?
I now know that the graph finds 25/40 Zigbee devices. Now how to find the missing 15? 
Perhaps a list?
tbh., I am little surprised by this number. I will have to check this
1 Like

