On the rare occasion I want to look at it from remote I just connect to my Routers VPN server I have setup. Usually I am only using them while at home though.
1 Like
And the good routers like Synolgy, Unifi etc offer a webVPN portal to make it even easier.
To that end many home NAS devices can setup VPN's or you can even use a raspberry Pi or similar SBC to setup VPN's with Wireguard or OpenVPN.
1 Like
Quite true, however, the prosumer routers do make this a metric ton easier and more secure and include a domain name with dynamic DNS. eg MySite.synology.me
1 Like
Nice discussion on this, thanks. Never used a true VPN before. I've used Jump Desktop before. Is there an advantage of using my Netgear Orbi router's VPN service over something like Jump? I'm just wanting to get access to Grafana dashboards on my phone while away from home. Guessing it's not going to be as seamless tho as just loading the Grafana dashboard on the mobile browser...
If the Netgear VPN is based on Wireguard or OpenVPN it should be super easy to turn on and off. I have used Wireguard with Unraid and now my new Unifi Cloud Gateway MAX. It is litterly a swipe down and a tap to enable my vpn whenever I want it on my android phone. Once that is done nothing is different from if i was home on my local network
I would definitely look at activating it on your Orbi since you have that ability.
1 Like
Yeah once the VPN is setup the only extra step is connecting to the VPN, then it should work in a browser as normal.
That being said, Grafana is designed to be exposed on the internet, such as if you hosted it on something like a VPS server. I imagine if you set it up with https (SSL) it would be relatively safe to forward a port to it. With out SSL I think you risk exposing the password unencrypted when you log in.
Yeah I was initially planning on setting up ssl with a self-signed certificate. According to Set up Grafana HTTPS for secure web traffic | Grafana documentation. Wonder if that’s safe?
But I just finished setting up a VPN and it is pretty easy to turn on.
1 Like
The key to understand here is that enabling TLS/SSL certs to allow secure communications is only the first step for security. It is a big one, but not the only one.
All that step will do is enable some level of encryption between the Grafana server and a remote client. That is good, and I would use the Letsencrypt option to create the certificate as well. But then you also need to consider the application that is now behind the certificate. This encryption doesn't help if that application has any vulnerabilities. This part of the reason why so many updates are constantly coming out for apps. Many times a app will have a vulnerability and then once found venders scramble to release patches to block the found vulnerability. So if you do this. Do your best to keep Grafana as current as possible.
Then I don't see anything on that page about hardening of the Grafana application. Generally if you put something on line you want to run through the config and ensure the server and application is hardened to prevent easily known methods to access in default non secure configs that often ship with software by default. A good simple example of this is the limit of what ciphers and protocols to use. In today's time no one should use anything less then TLS1.3 protocol with a high encryption cipher. I don't see anything like that described in their documentation.
That is why at one point I used Nginx Proxy Manager as a frontend to it. I could more easily control those components of the frontend and ensure TLS1.3 only. That doesn't help if there is a big vulnerability in the Grafana server itself, but it does allow some hardening for the part that this directly connected to the web.
If you did decide to setup https and put it on the internet, make sure you find and implement whatever Grafana hardening best practices you can find.
I would do the following
- Put a reverse proxy in front like NginX and enforce TLS1.3 with high encryption. Only forward traffic to the URL's you want access to.
- Use a very long complex password for the admin and any other user profiles
- Look for and implement any hardening recommendations from Grafana
- If you can setup firewall rules to lock down access in/out of grafana to only the ports needed. most specifically you want to treat the grafana server as a zero trust device. only give it access to things it absolutely need and only on the ports it needs.
1 Like
Seems like a VPN is the safest approach then. I created a Shortcut with the Apple Shortcuts app that both connects to VPN and loads up a dashboard. That, plus keeping a Safari tab group with the most used dashboards seems like it will allow ready access to grafana dashboards. At least worth a spin to see if that will suit! Thanks for all the input.
2 Likes
I agree port forwarding and/or TLS/SSL is certainly a security concern. I would certainly use a VPN. I've been doing VPN path for ages, but I've started to tinker in Tailscale. Its certainly a neat utility and makes interconnectivity from anywhere quite simple without punching holes in your firewall and within your tailscale instance you have all sorts of things you can do. But, yea, definently go for a VPN of some sort..
1 Like
Port Forwarding and TLS/SSL themselves aren't really the concern though. Those technologies have there place and are used allot for good reasons. It is more about understanding that once you do that you have to understand the risks that come with them.
Port Forwarding is simply taking a specific port on your edge devices and forwarding it to a specific port in your network. That in and of itself isn't bad. The concern is really about that devices that is listening on that port in your network. Is it secured and properly updated. The risk is the app that is being port forwarded and how it is managed.
A great personal example of this was my Arlo Hub that had the ability to be a NVR with local storage. It used Port forwarding for the app to access the Arlo hub. Port forwarding just ensures the communication is allowed. The security aspect is really with the Arlo hub itself.
TLS/SSL( or just secure sockets) is another thing that isn't a risk. It is used world wide extensively in a variety of ways. Using TLS though just secures communication between two endpoints. What it doesn't do is ensure the app or device itself is secure. You can have a web app that is secured using TLS 1.3 with a high encryption cipher and still have a buffer overflow vulnerability in the web app. That isn't a fault with TLS using the high encryption but the app itself.
Either way the safest option is just to use a VPN that goes through your edge devices like a router. I am personally weary of any vpn service that requires a agent installed locally. I no longer use NGINX as a reverse proxy server. I just use Wireguard through my Unifi gear. I had no worries when using NGINX though as there wasn't much more that could be done to secure it, but no need for that once reliable access via VPN was available
Started at the top of the post this evening with a Cloud install of InfluxDB and InfluxDB-Logger. Subscribed to a few events but nothing will post to InfluxDB. Once a minute the logs say "Post of 42 events failed - elapsed time 0.023 seconds - Status: 408, Error: https: Name or service not known, Headers: null, Data: null".
It seems like authentication fail. I've done a direct copy and paste of the All Access API Token and the host name, and so forth. Is it possible that some of my events are malformed causing this 408 error? If so, is there a way to purge these events?
Second question from the setup instructions - was there a reason for recording the Organization id and Bucket id (the 16 digit alphanumeric numbers)? Did I miss using them somewhere in the app settings?
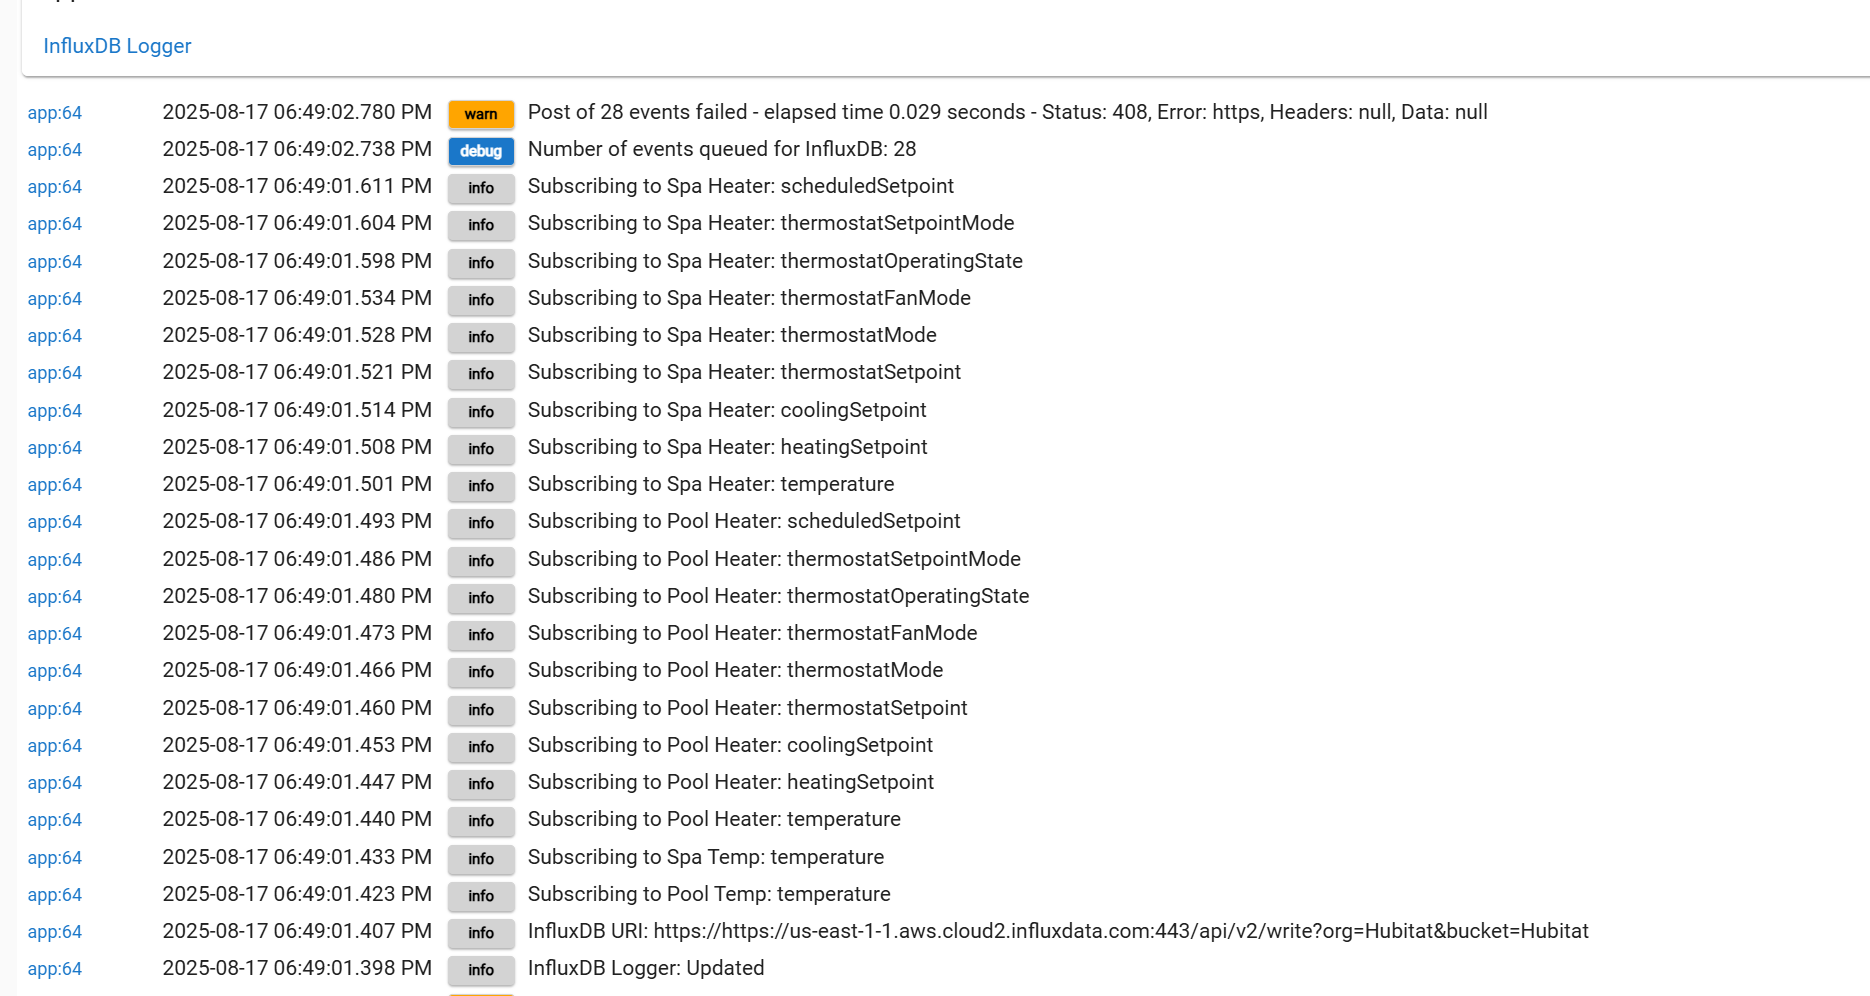
Never mind! Answered my own question by reading the log a little closer. The log entry:
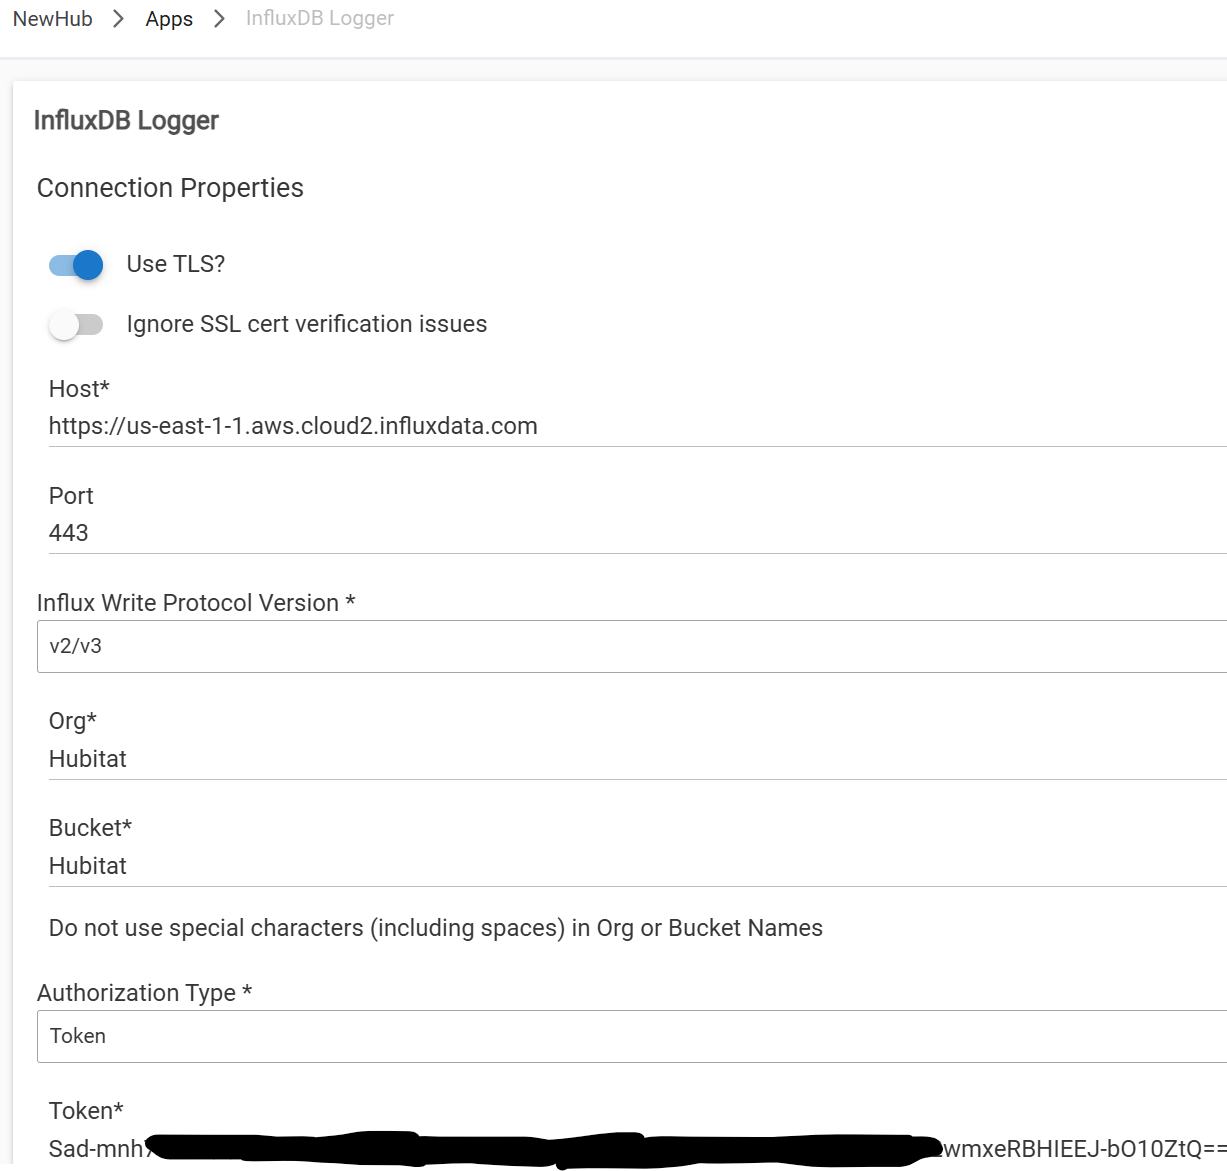
InfluxDB URI: https://https://us-east-1-1.aws.cloud2.influxdata.com:443/api/v2/write?org=Hubitat&bucket=Hubitat
revealed that the https:// part was duplicated. The app is prepending it to the url. Rather than "copy" the entire url from the InfluxDB GUI, you should only copy the host name.
Hope this helps somebody out in the future ![]()
1 Like
Odd situation. I have been struggling with multiple hub migration attempts over the last few month. The hub had this integration on it now today I still have 2 hubs left in service, but Grafana seems to actively see 3 additional hubs. I think at least one is a duplicate. but they all seem to have recent up time times. How do I figure out what these phantom hubs are, and more importantly, how do I get rid of them?

I beleive the first three are the ones that shouldnt be there. I know the first two hubs are physically disconnected from the switch and power and sitting on the shelf. So how is this getting any data from them ? I think the third is a duplicate of the fourth .
If this is all correct, how do I get these out of the dashboard?
Set your time range to the last 30 minutes or something like that. The old ones will fall off when the data ages out of the range you have set up top.
1 Like

