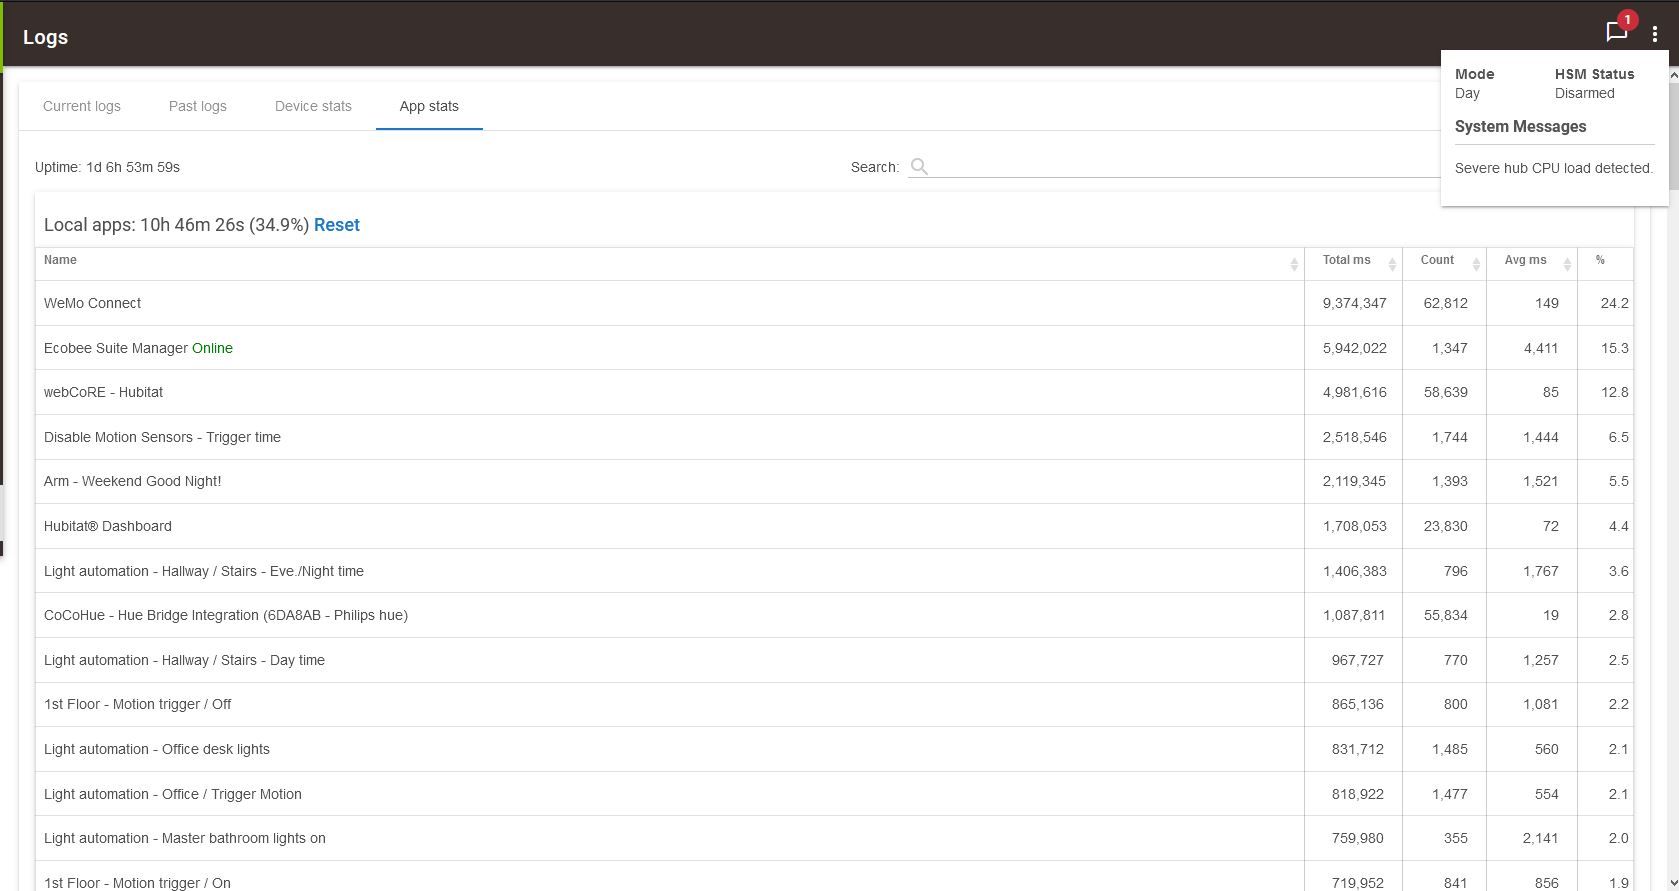
Which I think I can summarize as: This hub has been up for 1d 6h 53m. Apps have used the CPU 34.9% of that time.
Out of that 34.9%, The Wemo app was used the CPU 25.2% of the time, Ecobee suite manager 15.3%, Webcore (app + listed pistons) 54.8% and other miscellaneous apps used the rest.
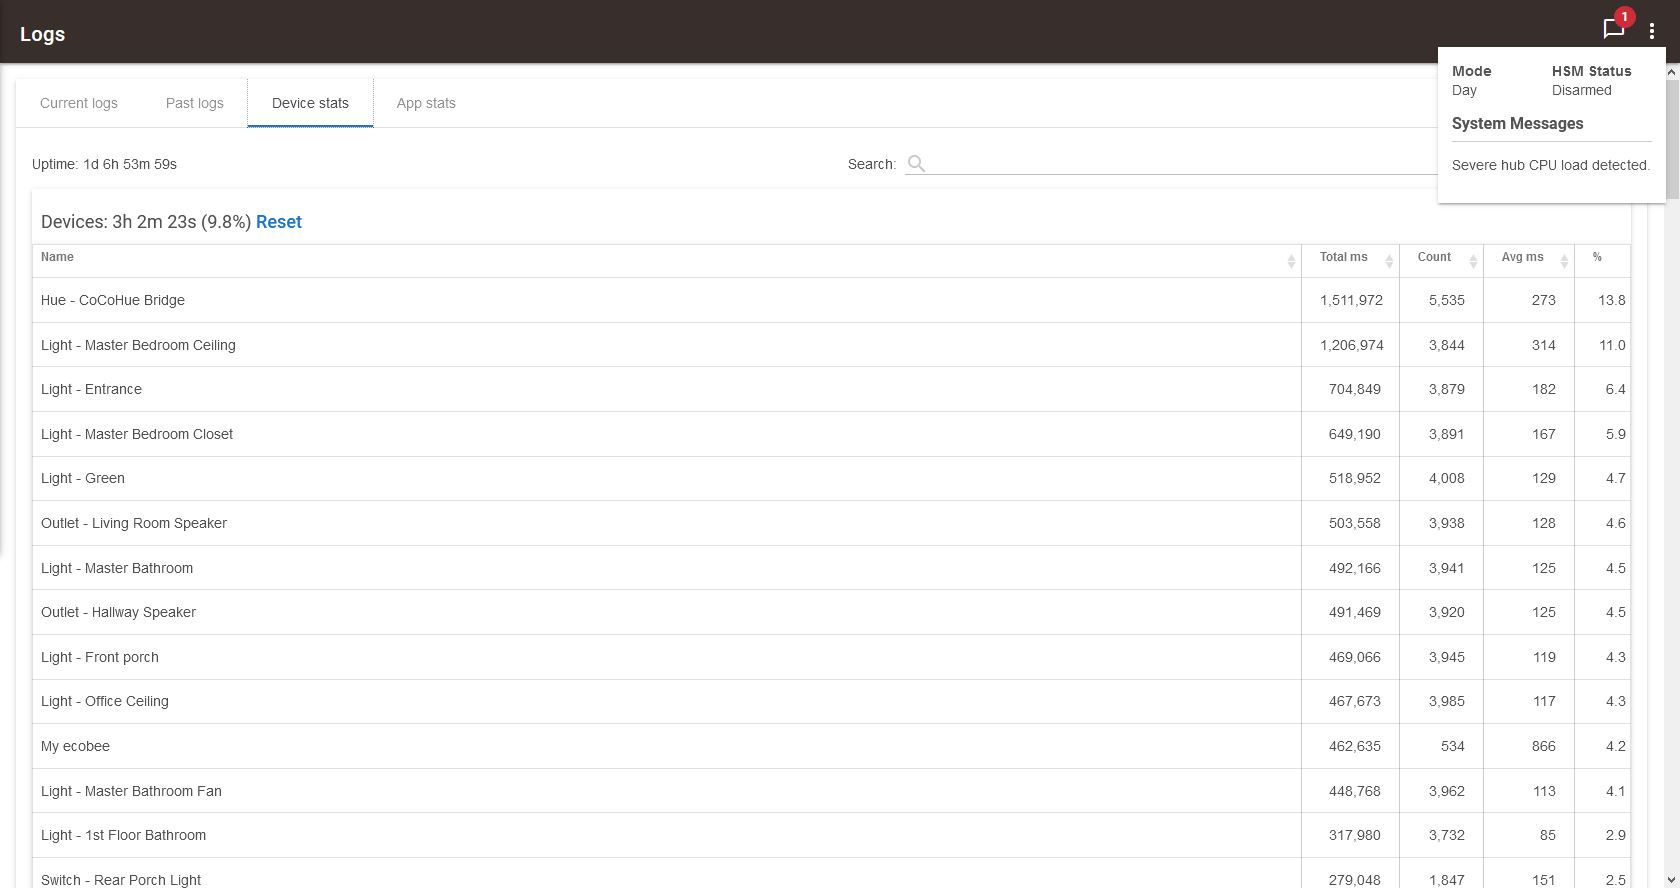
Likewise, I couldn't find a particular culprit when looking at the device stats:
So I am a bit at a lose here. Subsequent to the warning, my hub's performance definitely degrades. The web UI becomes slow an unresponsive and automations are slow to trigger.
I guess I am missing something, just not sure what. Any help would be appreciated, thanks.
I am very glad that the staff put in that load warning. I wonder if WebCoRE is also contributing to the issue?
I'm getting app stats: 0.2% (C-4 Net Only), 0.4% (C-5 ZB Only), and 0.5% (C-7 ZW Only) on my hubs... oddly the C-4 is the one dedicated to just cloud and network devices including HubMesh so would have thought it would be higher. To be fair I don't have a ton of stuff on it yet.
Interestingly all of my hubs show device stats at 0.1% - I have over 130+ devices distributed between the 2 C-5 & C-7 hubs and only a few on the the C-4.
It's quite possible, unfortunately I am not sure what threshold triggers the warning, so it is kind of difficult to pinpoint the app causing the issue.
Additionally, the lack of real time monitoring complicates things as well. For all i know, my CPU could be maxed out, but all I would see is the average over time slightly increasing.
Also, for reference, I am running a single C4 with 119 physical devices and 24 virtual, not sure if this is too much.
A while ago right around the release of the C-5 (I think) there was a period of time where there were a bunch of people including myself experiencing slowdowns lockups and having to reboot every so often. To get around this I added multiple hubs (by location: upstairs/main floor) and later offloaded my rules to an external server. Both of these steps help reduce my HE app count and presumably resource usage.
Even though my setup is slightly different now (multiple hubs by type / external rules) I'm guessing that it's the main reason for my super low stats. Seems to validate my approach as a good one for my use-case.
That would indeed explain the low stats. @JasonJoel, do you also use a multi-hub setup to spread the load?
I have considered that approach, but so far i have held off due to added cost & complexity. Although, having to constantly reboot my hub over the last 8 months might change my mind.
I have to agree with everyone, your stats seem high. My uptime changes whenever the nightly Hubitat Database Cleanup/Backup process runs so as it ran early this morning my uptime only shows as 9 hours, BUT my stats are as follows -
This is on a C4 running 90 devices. I used to have to reboot frequently (once a day or every couple of days) as my hub would either slow down to the point of being useless or freeze completely. One of the first things I did was to remove my Ecobee from Hubitat and that helped a lot, but did not fix the problem completely, still had to reboot once or twice a week. I then did what @erktrek mentioned and offloaded all of my rules to an external server (node-red). That stabilized my hub significantly. Next step was to go through and determine if I really needed every one of the apps I had running. These steps over a period of 3-4 months got me to where I am now. The only time I reboot now, is if I decide that an update to the HE code is worth me installing it.
i have higher stats about 5 % for apps and 4.5 for devices. .the apps stats are misleading and eroneous for web connections like my email , etc. because it logs the entire time it takes to connect and send an email but that is mostly cloud delays not really hub usage.
I used to reboot daily to avoid hub slowdowns prior to adding a second HE hub. It has been over a year now since adding the second one and I haven’t regretted it. I do try to avoid WiFi devices like the plague though since they seem to eat up the hub’s cpu time. For instance, my original hub is running Echo Speaks with 10 Alexa devices plus around 40 Zigbee and 23 z-wave showing ~1.3% app and device usage with ES (app and devices) using around 1/3 of that which doesn’t seem unreasonable. One my second hub I have 6 TP-link devices and 70+ Zigbee, plus most of my RM and ML rules, as well as CoCoHue with 2 Hue hubs and over 300 total devices. Somehow the TP-link devices are using 1/3 of the cpu time on the hub with no energy reporting which seems ridiculous. My hub load is still only a little over 3% though. I haven’t had to reboot since 2.2.3 was released.
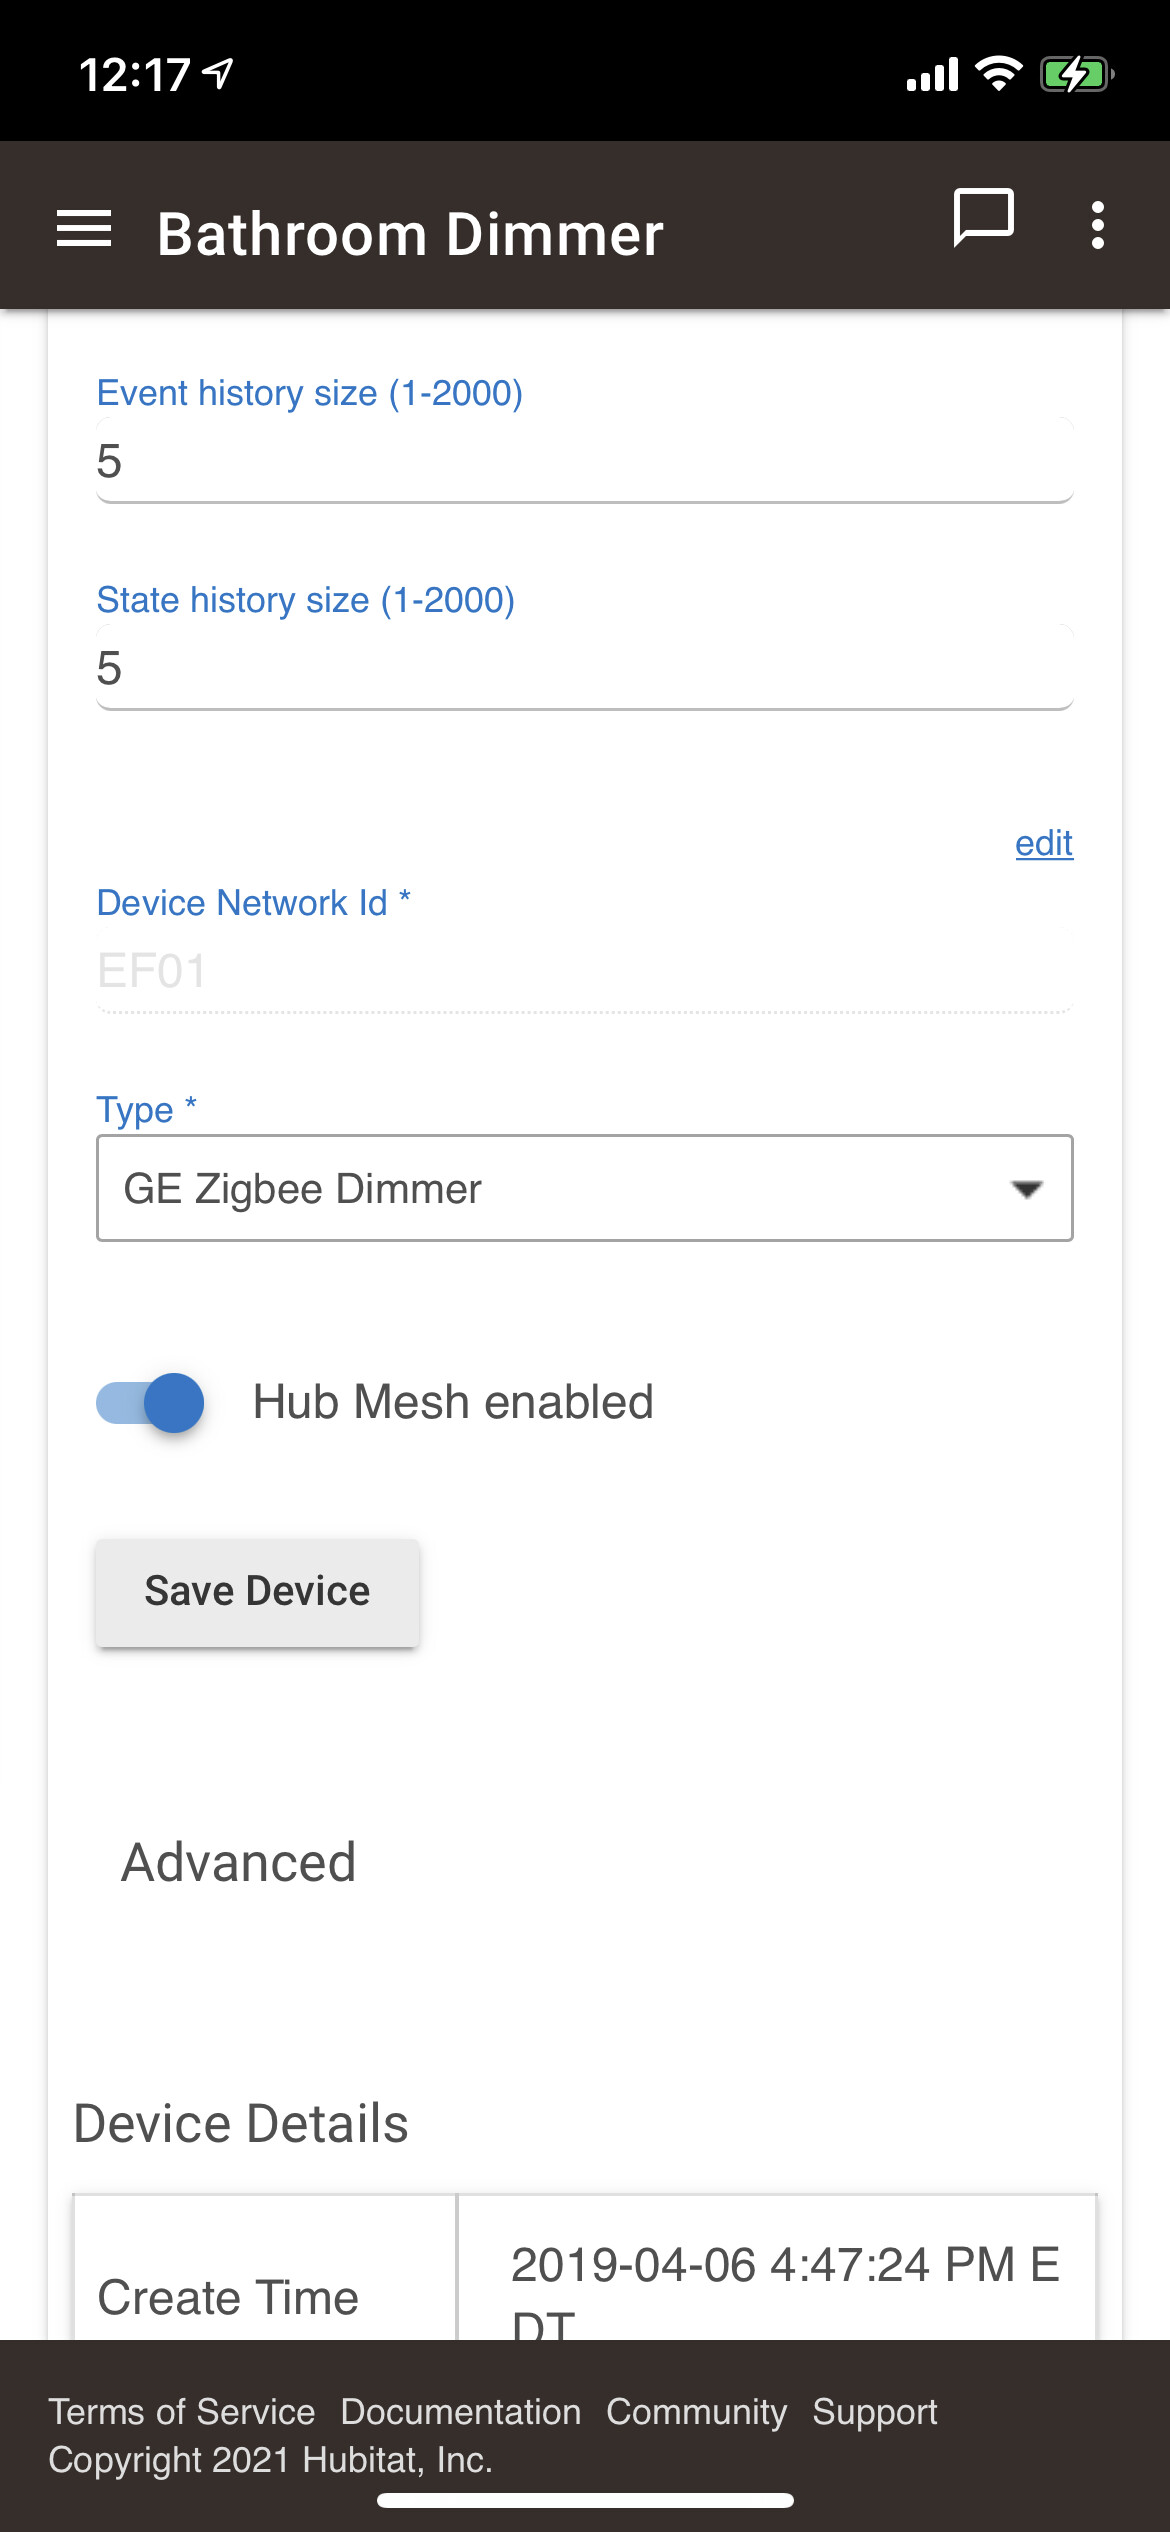
Edit: I also reduced the state and event history sizes to 5 on most devices
So after asking on the Ecobee thread, it looks like that app's CPU load is somewhat normal. I haven't heard back about the WeMo app, but with Wemo being what it is, I would expect it to be normal as well.
I guess this, plus WebCore, which i use to run everything, is the cause of my issue.
I do wish there was a way to dig a bit more into this. Real time data in combination with historical data would be very helpful in pinpointing which event is causing an app to misbehave.
some of my tplink/kasa devices are high too, but again i believe that is time waiting for them to respond and some are slow at responding and have longer ping times, I dont think that really impacts cpu as the cpu should not be busy waiting during that time. That is why I said it is not 100% accurate expecially for cloud devics. I believe the stats are simplistic and count the elapsed time from startup to shutdown.. I have seen that with email where it may take 1-2 seconds for the port to open wheres during that time the cpu is not really busy.
Yes, I ended up going with a lot of wifi devices and while there are certain advantages to it, there is definitely a higher overhead price to pay.
I'll try reducing the state and event history,
any cloud implementation that takes a long time to run due to cloud delays is always going to show a high usage with the current implementation depending on how long the app /device is sitting there waiting for the cloud or internet to respond.
That makes sense, but at the same time i think something must be spiking the CPU as reflected by the performance degradation.
Although it is hard to speculate since I have no clue what threshold constitutes a severe CPU load.
Kind of, but if the CPU spikes for 5 sec and idles for 5, I'd get a reading of 50% which would be rather misleading.
I guess the systems events tab lists what occurred before the warning, but I haven't been able to reproduce the issue by re-trigering the events that occurred before the CPU warning.