Show Off Your Dashboards!

Thanks for the details. I'm able to create those, but I'm still looking for the elusive status of Smoke and Water monitoring (either armed or disarmed) and of course that custom monitoring rule where the Panic is set up. I think the workaround is to not use the DisArmAll option at all. I hate that there are things that you can only access via the web UI. I wonder if I could create a web util that scrapes the Apps page looking for the status?? Hmm.... At the very least, I'm going to put in a request to the HE team to see if they can reveal those status attributes somehow in a future release.

That's pretty slick.

I've been using Influx and Grafana with ST and now Hubitat with the InfluxDB logger. I never thought about using the maker API.

1 Like

I guess I'll throw some of mine in the mix.
Using Fully Kiosk on a Fire HD10 in a MakesByMike wall mount with custom made frame.
Echo Dot 3rd gen in Mount Genie flush mount next to it.

11 Likes

Is anyone else noticing viewport changes on the iOS HE app?
My dashboards are now larger and the columns don't fit well within the view in HE. I'm wondering if they changed the default CSS or something in 2.2.5, as without doing anything my native un-touched dashboards now don't fit well on my iOS device (iPhone 12).

@SoundersDude I can't say I've noticed a change on the mobile app dashboards. I could say that the buttons look 'taller' than they were before, but everything still fits. Mine scrolls for a few pages, so I'm not sure how many rows I had on a single screen before the upgrade. Width-wise, it looks the same.

1 Like

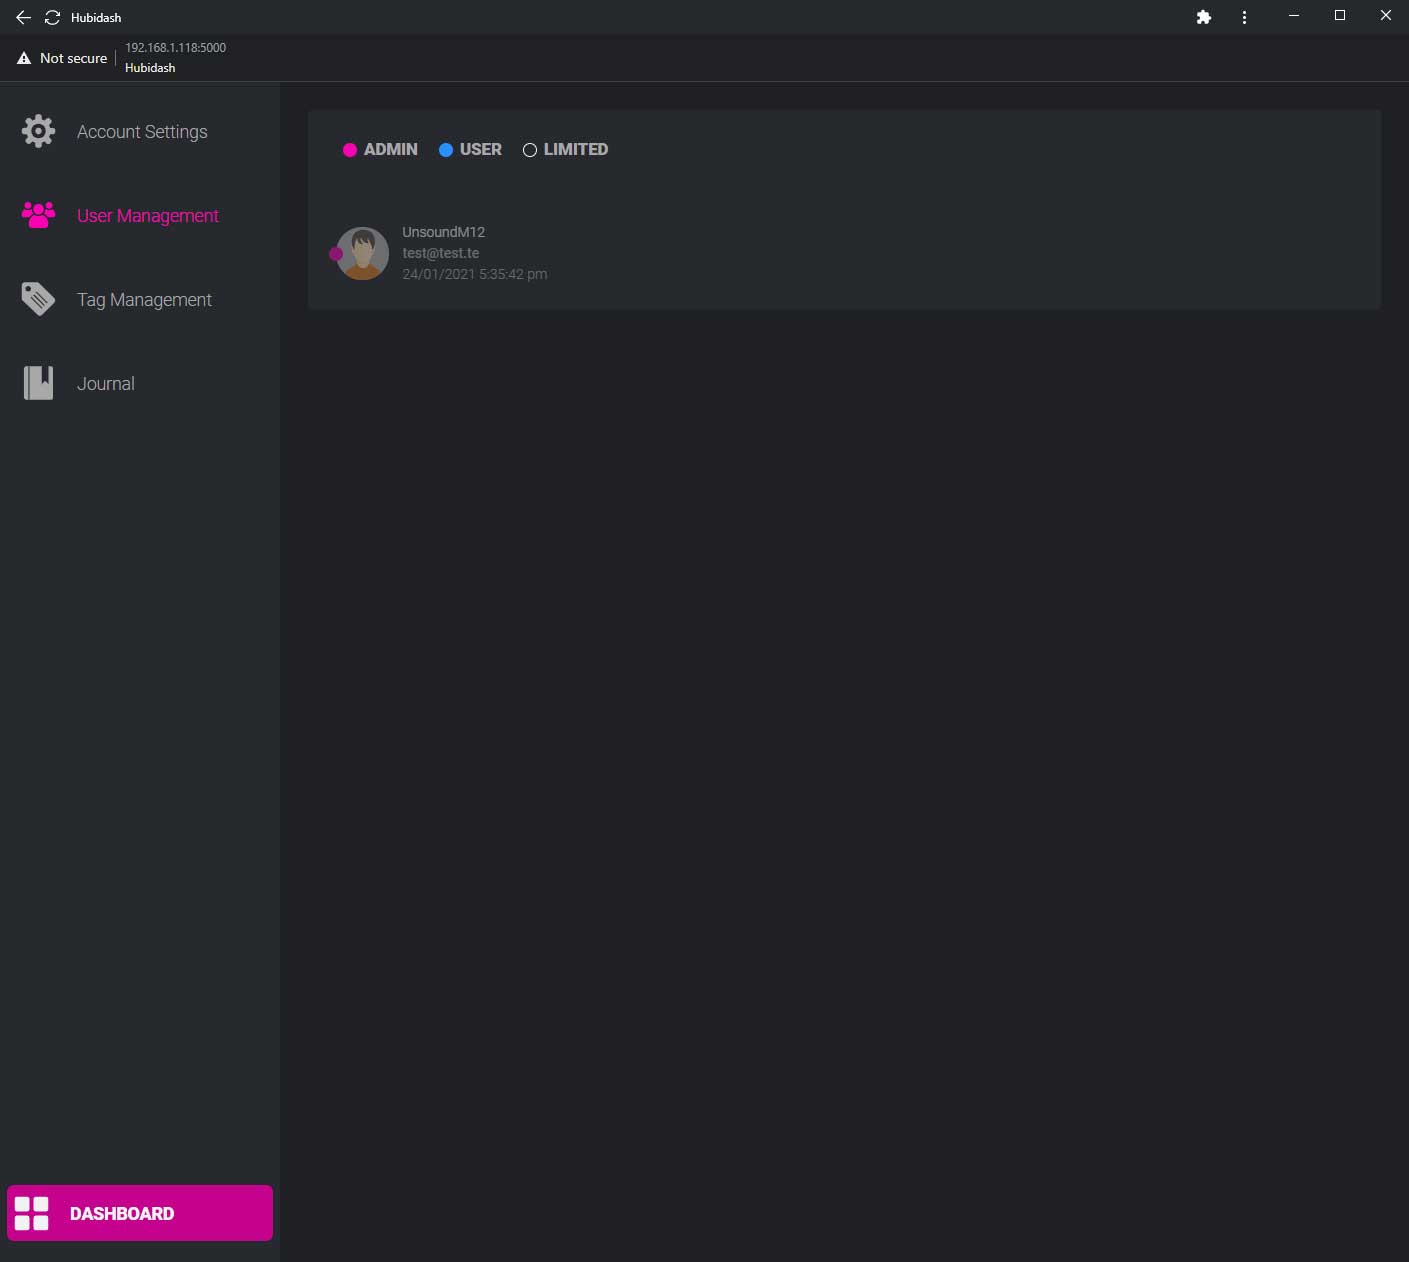
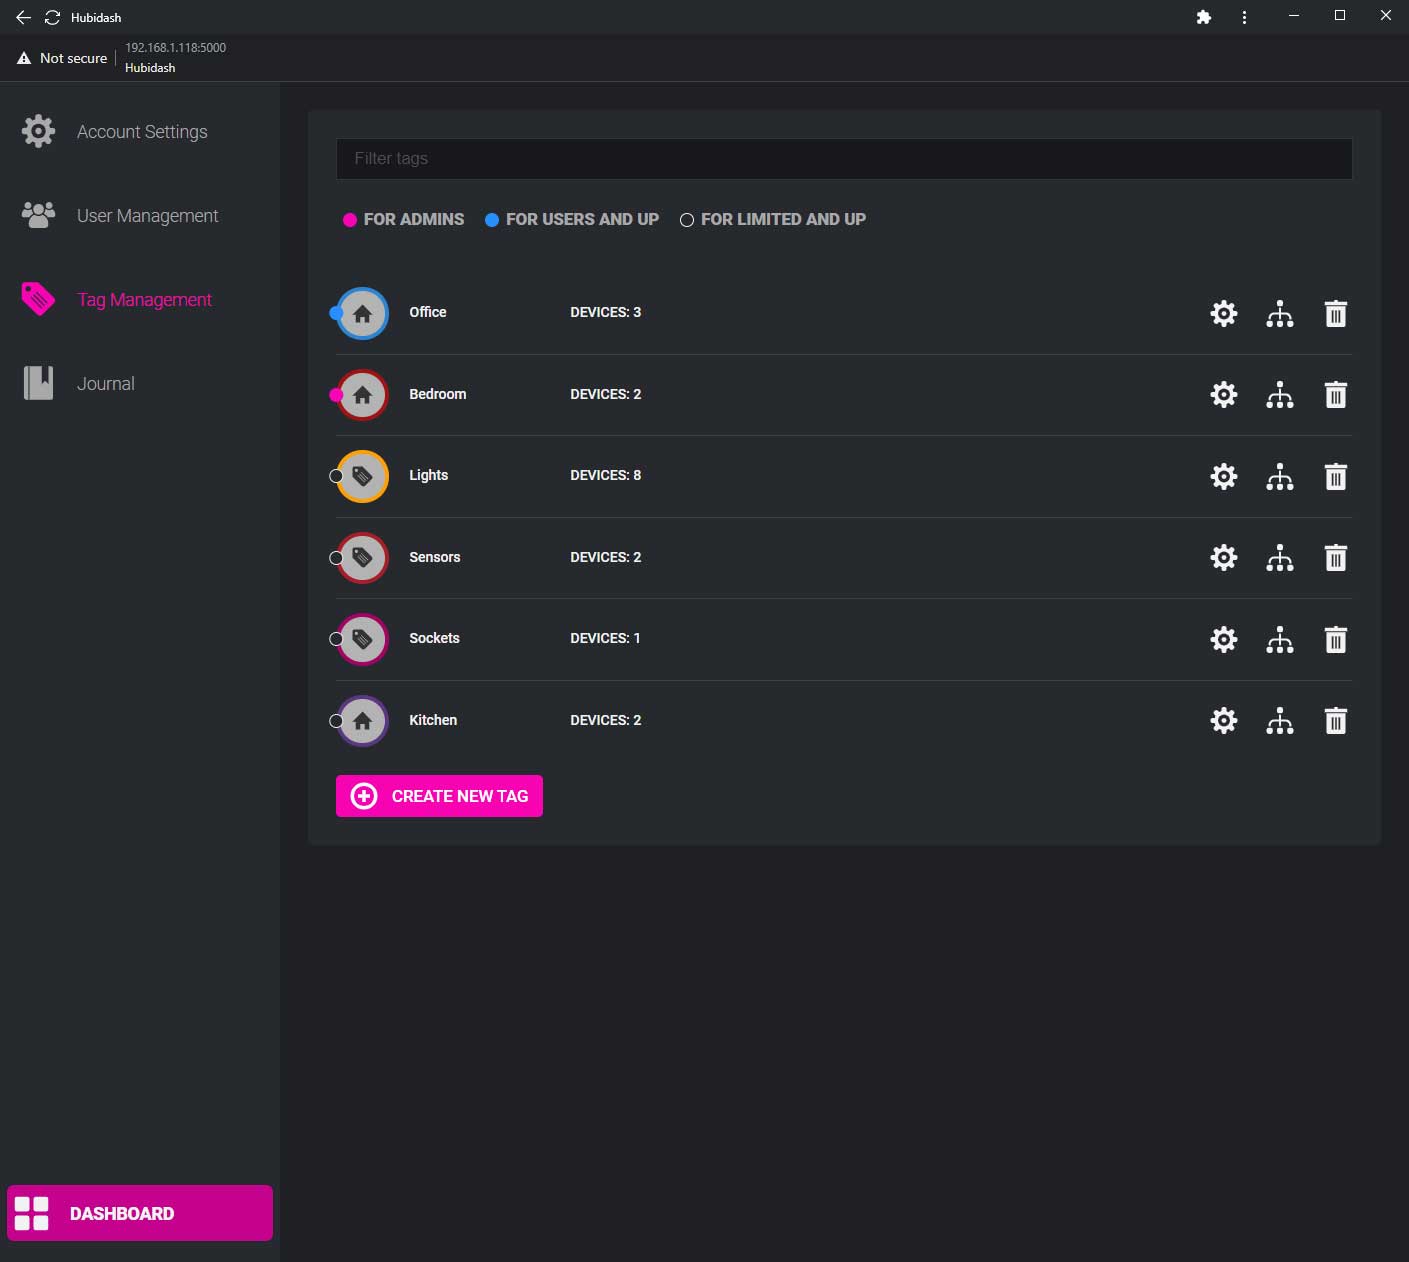
I am finishing to develop a custom dashboard that works with Hubitat Maker API. It is deployed on Raspberry Pi and uses MERN stack. It has support for users with different access types, login-sessions, easy device sorting and access and convenient logging.

As much as I LOVE Hubitat as a product - it's dashboard sucks. Visually and performance wise. Loads slowly and takes too many clicks to get to. Not even talking about customization options.


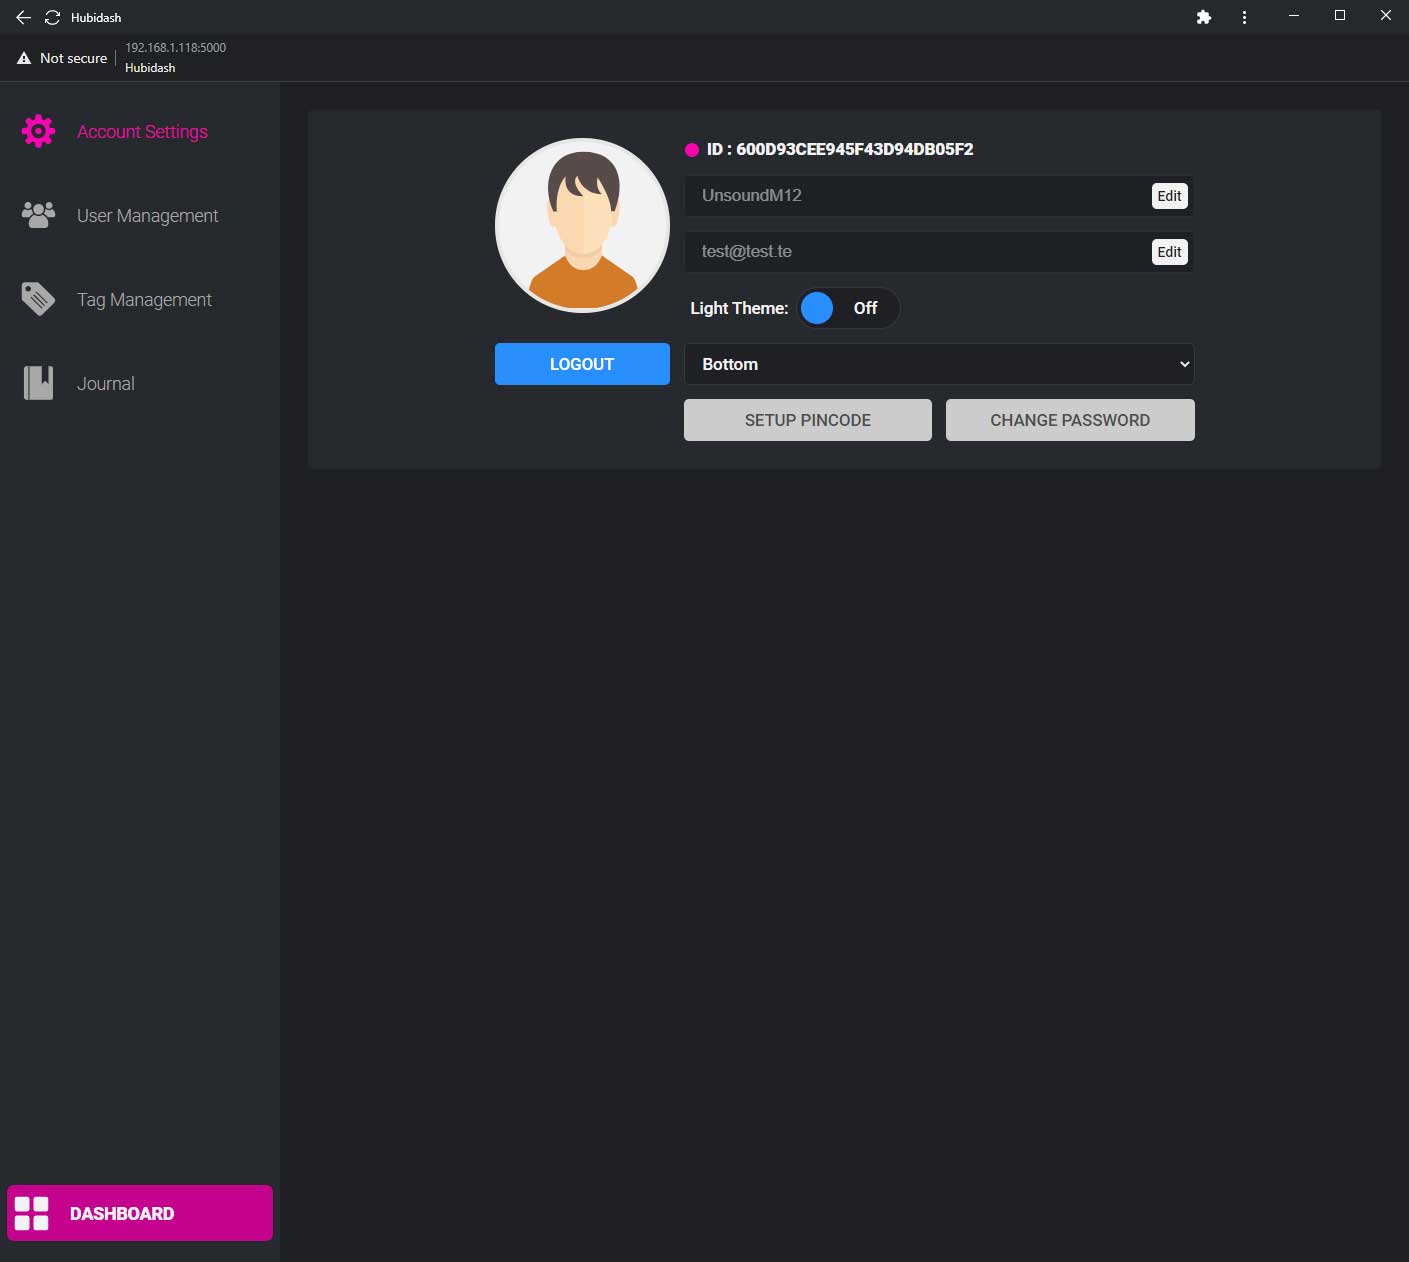
In the end it turned out to become a pretty big project with a lot of features. It is a PWA, so obviously it support mobile devices as well as desktops. Super convenient, if you created a desktop shortcut quick-access link to it on your device - it feels like a snappy native app.

UPD: Now available here: Custom Dashboard [Hubidash] Release

8 Likes

Maybe a dumb question but do you have the dashboard configured to use a specific row height, leaving the column width blank? On my iPhone that gives me a perfect width (two columsn) and then scrolling for any additional rows that don't fit in the height.

I like the kids' point tallies with the custom background images! Cute idea.

1 Like

@good.looking.blues That looks really nice, ready to share that to the rest of us? :slight_smile:

I know... too many to look at...:slight_smile: I finally have all the custom things built and now I want to clean things up.

Quick Question... I played around the iFrame.groovy device written by @mbarone in the past... It worked well to show URLs in a tile. I put it in my notes to go back to when I started the task of sprucing up my Dashboards. I started working on new dashboards today and I noticed that the only URL I can show in an "iFrame" Tile is the Hubitat hub. External URLs won't show up. Also, other dashboard items created through Hubigraphs to external sources work fine. Anyway, Is anyone else seeing this or did I miss something?

I use the iframe driver for local resources on my network including basic webapps and grafana charts on various local virtual machines, but it should work for internet resources as well.

Some websites block being used in an iframe and this might be what you are running into.

You do need the full URL including https:// when setting up the iframe driver.

@mbarone Thanks for the response and tips. Grafana is what I'm trying to point to..:-). I'll do some more tests.

I'm on an older version of grafana as I set it up a few years ago and havnt upgraded it as its working fine, but I did have to modify the install to allow anonymous views to the dashboards.

I'll try to find the link that helped me and add it to this post.

@nielsen411 Edit. Here's the link

1 Like

Got it... and working! also need to set "allow_embedding=true" grafana.ini to allow iframe calls (per your earlier tip).

Emproia Vue Power Meter is now rocking my Dashboard.

Thank you

1 Like

Seems that nobody cares except you. :slight_smile: That is not good enough motivation to invest the time into steering the project into open-source. Plus it is not ready atm. If there would be at least ten people wanting this - I would consider making changes to make the code available and writing a proper manual for it.

1 Like

You can add me to this, if you will :slight_smile:
Always on the lookout for a better dash. I'm currently integrating HA into my setup just for this :expressionless:

It looks great!! Nice work :+1:

BTW, I think you would also get more requests, if this was in a post of its own. Its kind of buried in here. Just my 2p's worth :slight_smile:

Done :slight_smile: Custom Dashboard [Hubidash]

1 Like

I just finished a prototype for my Mom's new dashboard. The button on the lower left will be for the interface to Alexa and use Echo speaks to play her music:

Here is the prototype dashboard for stations and transports for music:

I was working on it... Here you go --> Tips on setting up Emporia Vue and how to use iFrame Tiles to show Grafana Panels in your Hubitat Dashboard

Thanks for the nudge.

Hi, I'm a new user in hubitat, what cameras do you use for the exterior? i'm looking and i'm lost