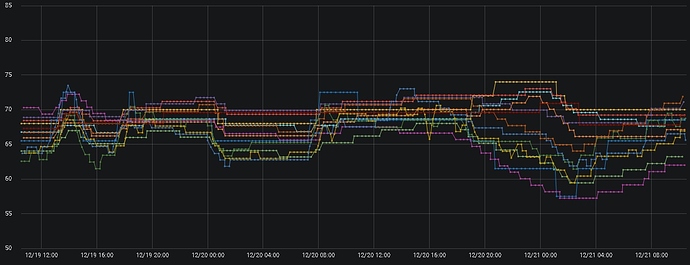
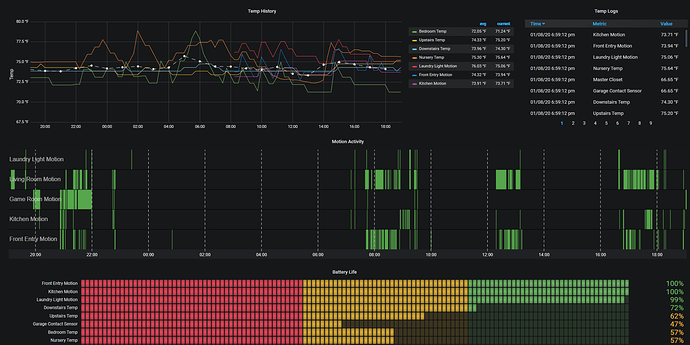
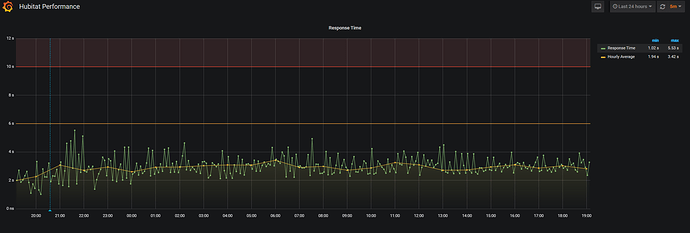
When you choose to create a new panel, one of the options should be "Discrete". I believe it is a built in panel...if it's not there just search for it under Configuration (cog icon) -> Plugins and install it.
Before I think about trying to implement something like this would like to understand what level of knowledge or experience Is required to implement this. I really like what I see but more times than not it seems it decent level of programming is required for any of this or a deeper level of understanding of Linux.
What sensor do you use to monitor the hot tub temperature?
The one built in to my Intermatic heater.
I use this with Smartthings and it is adequate. It only shows data up to 1 week before and seems to filter data that is constant. It would be useful for Hubitat anyway. Is there any other alternative that does not involve installing a server device at home, such as Simple Gdrive Logger in Smartthings?
I use Hundredgraphs with ST and it works alright but only has 1 week history. If someone can migrate the Google Sheets Logger from Smartthings, it would be a decent enough and easy alternative to the whole InfluxDB thing.
Of course, after I make a PR I see there's already another one by @morse.caleb . Well anyways, I was really worried about the potential for a ton of http calls in the stock InfluxDB app. So I added simple write combining and queuing of data, and then stats to see what devices are sending a lot of data, and what the average queue size is.
If anyone is interested:
I'm mainly worried about threading issues, but it shouldn't be hard to fix using similar style to @morse.caleb .
@ogiewon How did you setup the Compressor graph so you able to overlay the heat/cool on top of the compressor? I think it has something to do with the right Y axis, but I can't figure out how to set that up, much less associate anything with it.
Found it. Click on the color to the left of the name.
Yea, getting the data series to use the right-hand Y axis is not intuitive. I don't recall exactly...I think you have to click on the small color bar next to the name of the series, and then select the Y-Axis Tab, and then pick whether you want the left or right Y-Axis.
Do you mind if I take a stab at converting your InfluxDB-Log code to use MariaDB ?
Forget that....
I am the one of creators of HundredGraphs and yes, the Free Forever plan is free. Unlimited devices with 1 hub pushing data and data retention for 2 months.
You can use a free API (but have to create some script yourself) or you can use a free plugin (currently only for Vera and ST)
We are looking into adding more plugins for our service and Hubitat is on our list as well. We would just like to know how many people will be interested
I'm interested for sure.
+1, that would be awesome.
Yes, Please
Yes.
Definitely interested
Just wanted to share that I also set up InitialState tonight. Very easy! See instructions above - just make sure you edit the key before you add the app. Already been tweaking the code (no, I'm not a coder) to add other sensor values. No server required!


