I run InFluxDB/Grafana on my Freenas server in a jail. Virtually no overhead and the server is already on 24/7.
I found it useful to read through the Codersaur page that someone mentioned.
2 Likes
Just got Initial State working perfectly with Hubitat using their DIY Smartthings app. Not much in there as I'm still porting from ST, but worked great. And IS now has a free tier... =)
1 Like
That sounds exciting. I've been looking at something like this. Do you think it will be more stable than InfluxDB ?
influxdb looks like it's more friendly for local... but InitialState is used by some pretty heavy data producers. It's certainly worth a shot.
2 Likes
Yeah, I am just looking for something to graph my temps and other simple stuff. I think this really hits that sweetspot. Thanks for sharing the code 
EDIT: Now that was extremely easy to implement. I'll take some baby steps but I like the environment.
You mention that they now have a free Tier, but I can´t seem to find that one. Will it perhaps only be shown after the 14 days trial is over ?
1 Like
Well, I actually found the information about the free Tier. Seems to be only for .edu addresses and only offer 3 months of history.
Free Plan Users
There is a free plan offered on the new service for any students with an edu email address that also includes 3 months of data retention, Real-Time Expression, Public Shares, and iFrame embeds. Otherwise you will need to upgrade to the Individual tier on the new service.
1 Like
darn, sorry. (I do have an edu address).
I do note that's for legacy accounts. If you sign up for a new individual account, I think it is only $10/month. Which, is a fair amount, but certainly cheaper than the crazy $1000/month or whatever it used to be. lol.
Nothing to be sorry about. It is a nice service and I am already sending quite some measurements to it. I'll see what I will do in the future. I like the InfluxDB and Grafana approach, even though I would have to spark up a RPi for it, but I don´t like the reports of the instability of it, so this is a good middle step
1 Like
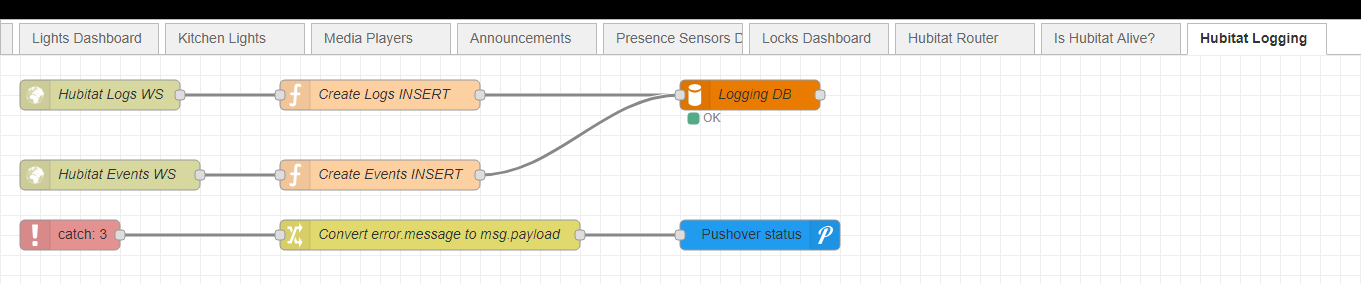
So, just to add what I'm doing. I wanted something completely local that captured both logs and events. I'm using the undocumented web sockets for both, NodeRed consuming those and storing all the data in a local MySQL database. This way, my hub can focus on controlling my devices and automations and not have to push out more local net traffic if it doesn't need to (beyond what it is already pushing out for web sockets).
For graphing, I'm using Grafana (which I'm still in the process of setting back up after one of my NAS drives went south last week (sigh)).
I had thought about using the InfluxDB driver, but I'm trying to use as few 3rd party apps/drivers in my hub as possible. So, I figured out a solution that doesn't add anything to my hub and takes the overhead of network and processing traffic and shifts it over to my home server. I also didn't want to run another InfluxDB or Prometheus instance when I already have a large MySQL instance running and used in other things for my setup.
This is the NodeRed logging flow I created:
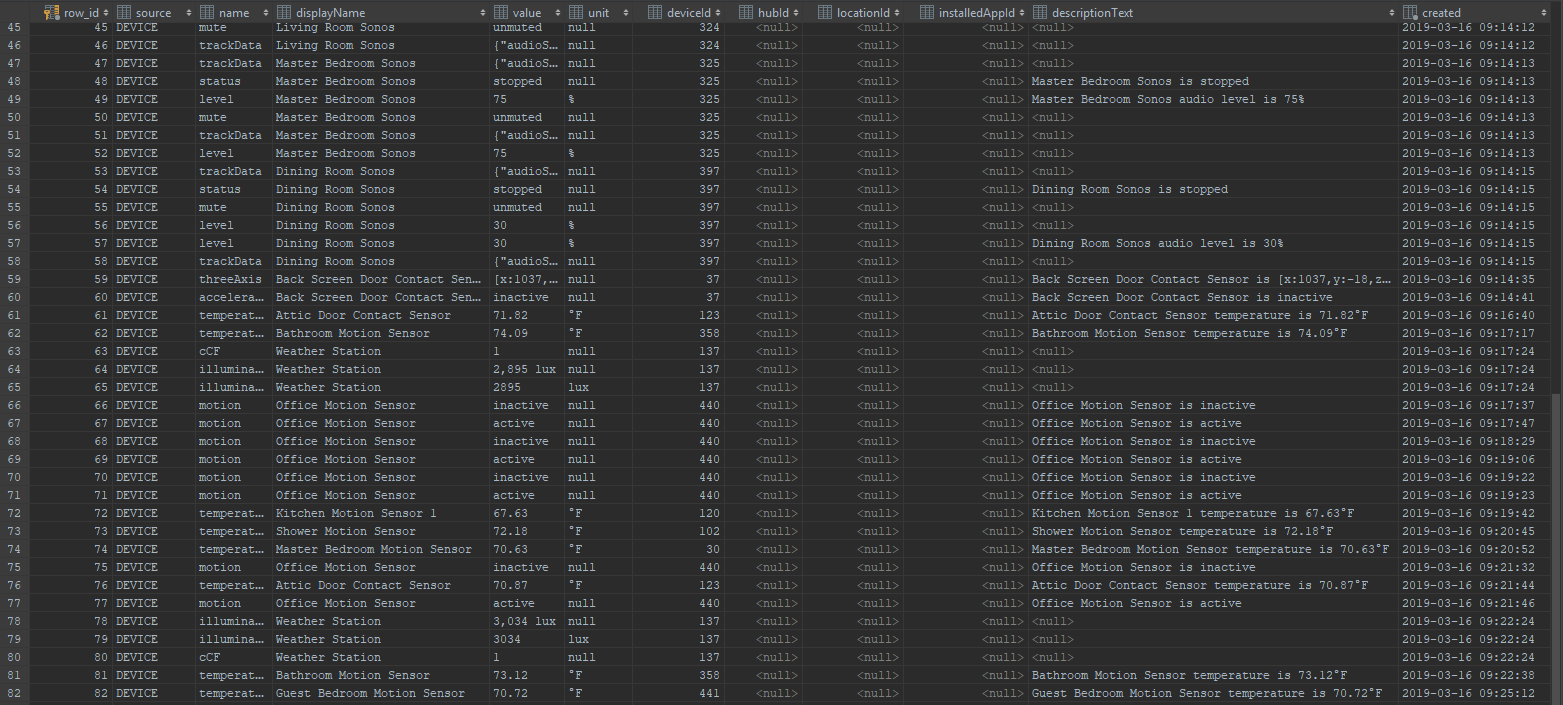
This is my events table:
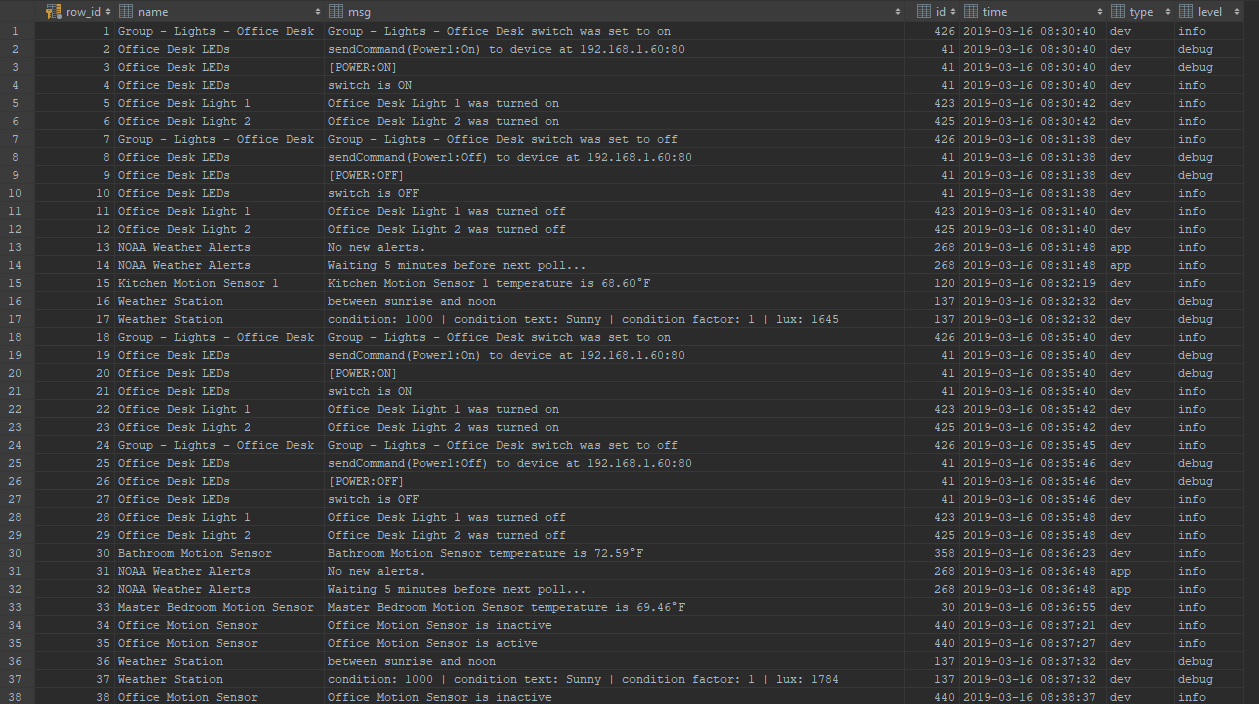
This is my logs table:
3 Likes
Now this is exciting, and they claim it is free !
Who is able and willing to write some code so that one could potentially use this service ? Looks very similar to Initial State.
2 Likes
Could you help me with the log websocket address? I’m successfully following events but hadn’t realized I could also access logs?
Thanks.

Thank you.
1 Like
How many devices you guys logging in InfluxDB? I have about 20-30 devices and suspect that this maybe slowing down the hub. I have been getting the "Zigbee network is offline" message lately, and I suspect it may be related to this app.
I have around 25 devices and it's working fine, but InfluxDB it's not on a RPi but on a Ubuntu VM, I don't know if DB writing times could impact as well.
Mine is running on my Freenas server which is plenty powerful.
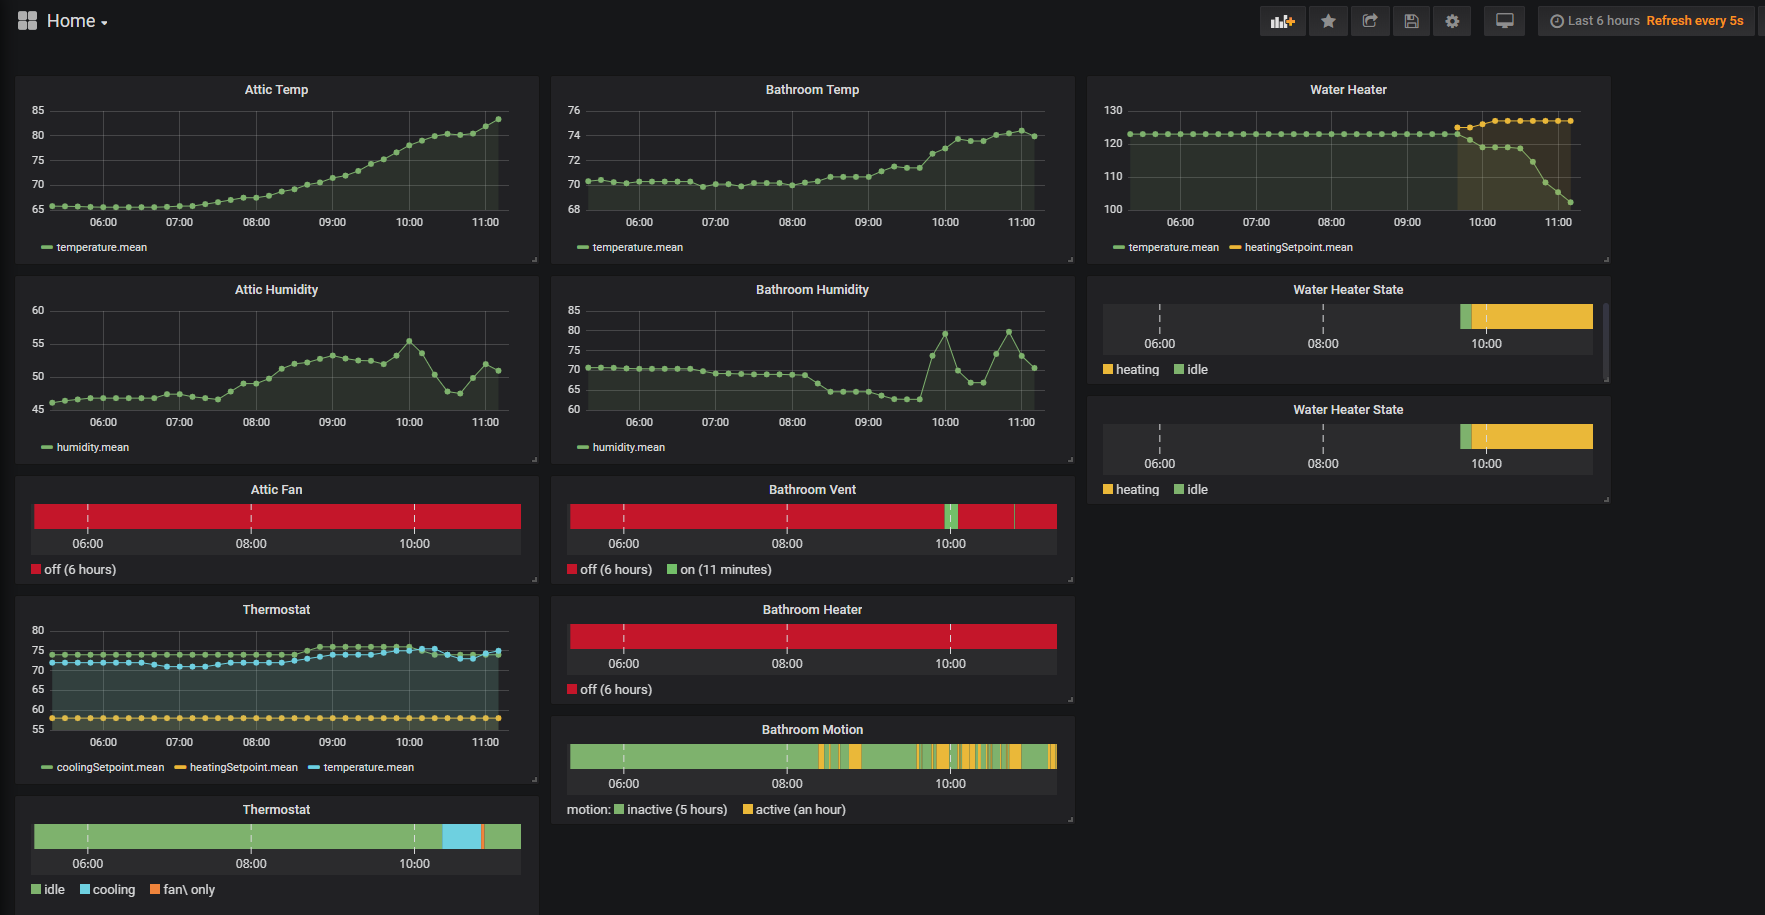
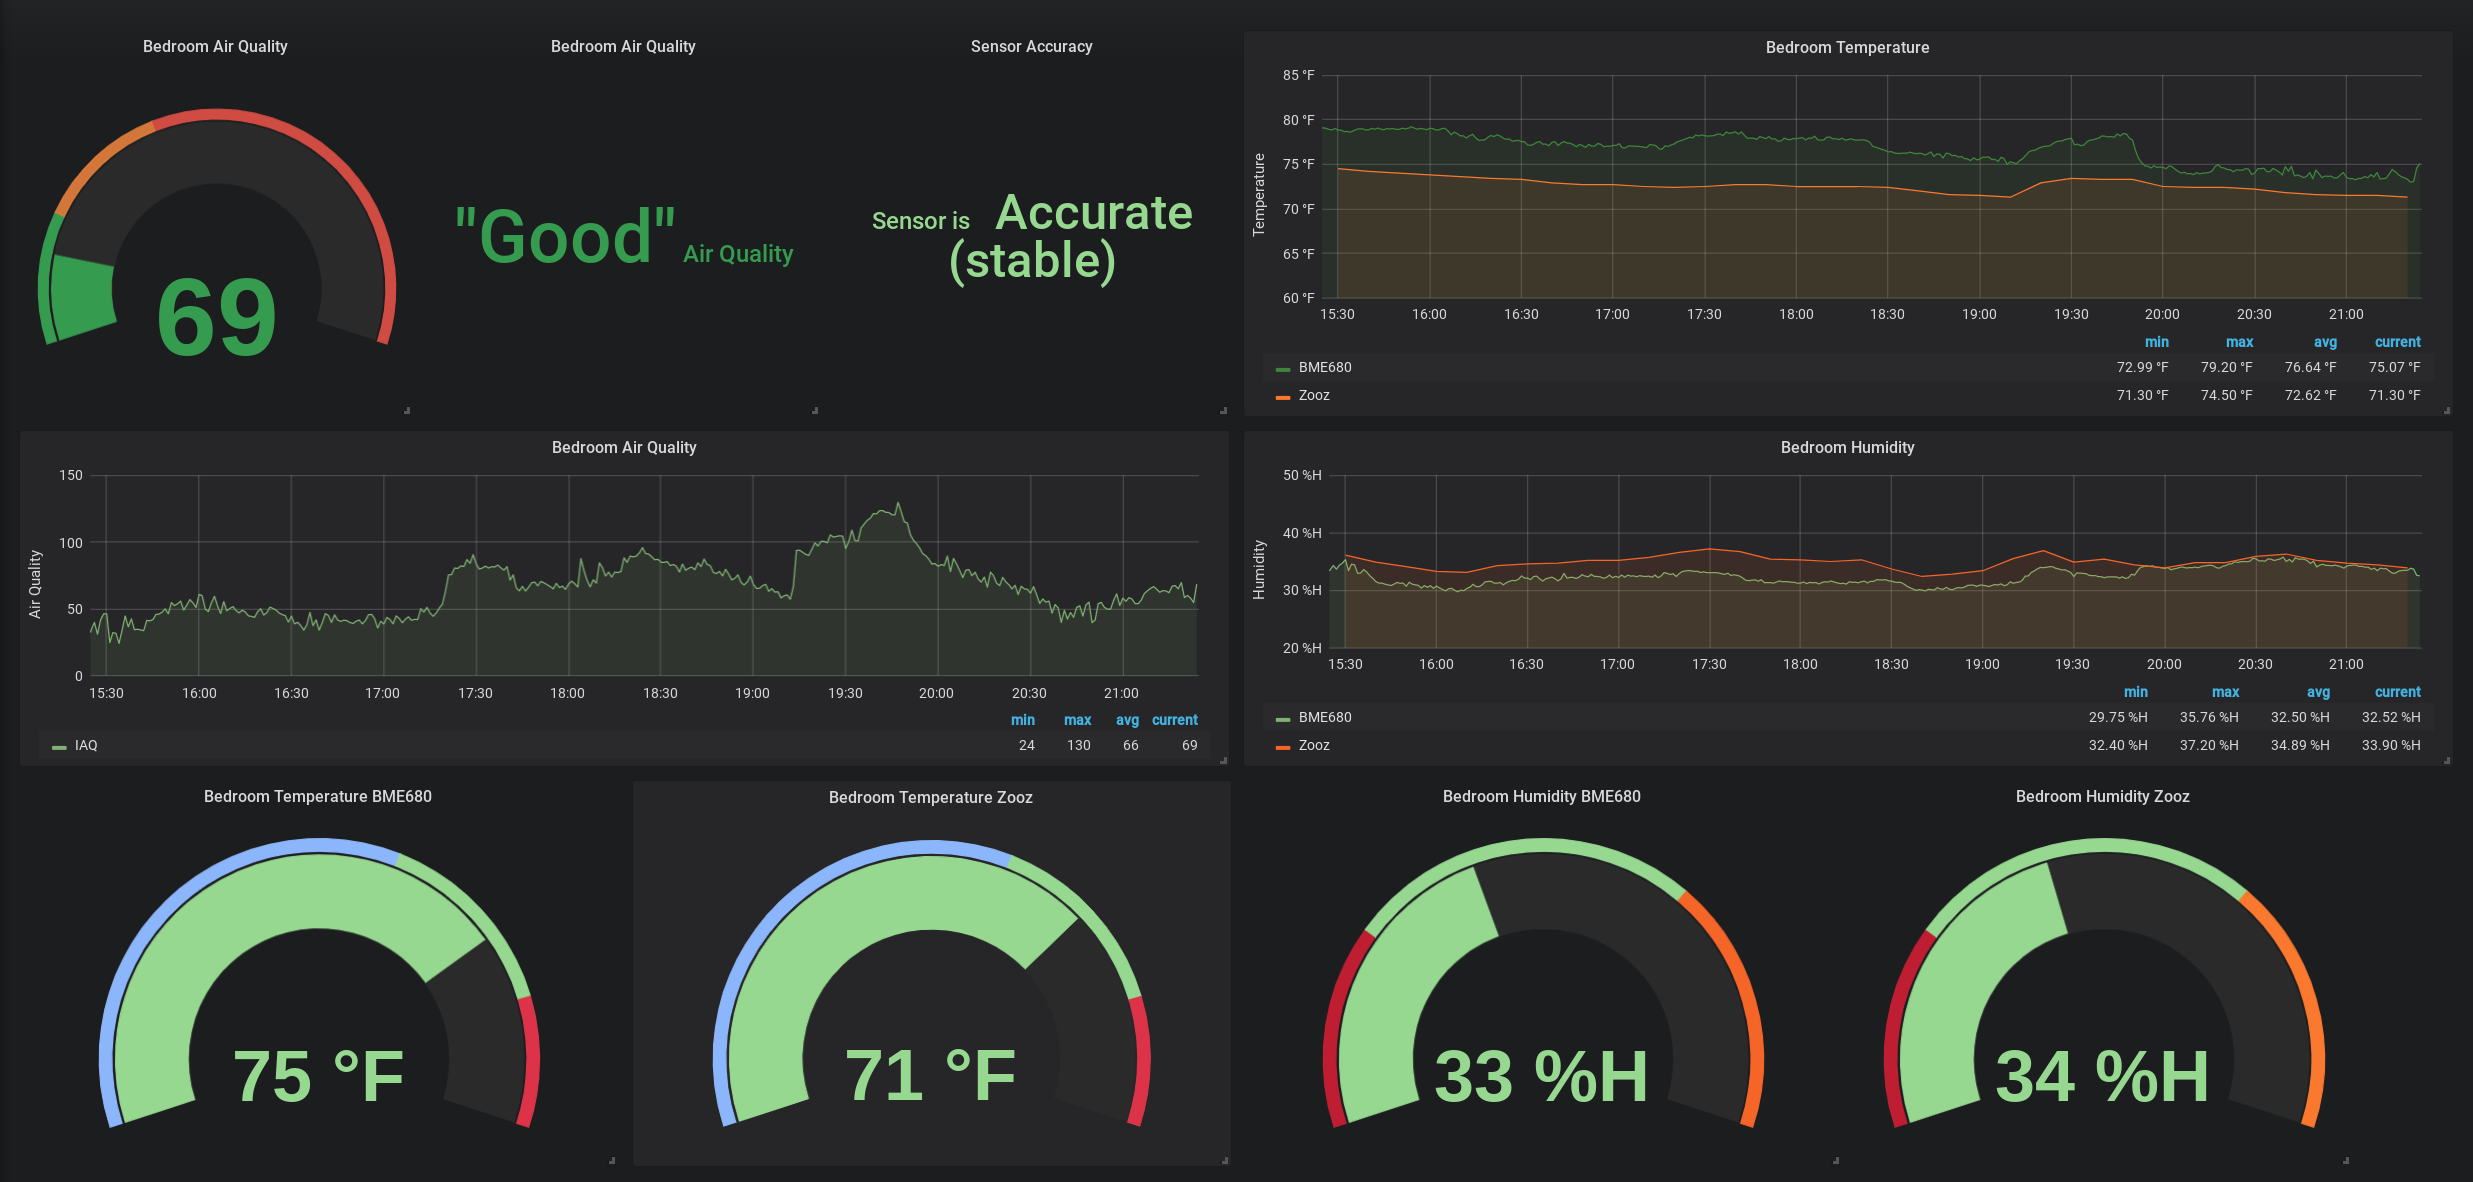
this is awesome! I love how I can see the automatons work and how the fans brings the humidity down etc.
5 Likes
how did you make the the active/ inactive motion bar? im a grafana noob and cant figure that one out.

