Occasionally, all of my Zigbee devices quit working and system events shows the Zigbee radio as offline. Sometimes there's a "severe hub CPU load detected" error to go along with this and sometime there's not. Sometimes the Zigbee radio just goes off and on several times in a row. The logs usually don't show anything odd when this happens. As far as I know this started fairly recently. Nothing has been added or removed aside from updates to existing apps or drivers.
I spoke to support and they basically just confirmed what I already knew and told me to start disabling stuff until it started working again. It's very intermittent and I don't really have the time or patience to sit here disabling things all day hoping it starts working. I'd rather someone who has had a similar issue point me in the right direction.
I do use quite a bit of modified drivers, some from the community and some I've edited myself. Almost all of my automations are done with webCoRE. I'm using Ecobee Suite and Echo Speaks, which seem to take up a good amount of resources from what I'm seeing in the stats. I've disabled both and the issue continues.
Anyone got any idea where I should start with disabling things? Like I said, I haven't added or removed anything in months and this just started in the last few weeks so unless a package update broke something I'm not sure where to start.
Anything that does a large amount of polling or HTTP calls would be my first suspects. Devices that report a large amount power usage or other state changes are generally prime suspects also.
1 Like
I've disabled anything that involves HTTP requests and all devices that poll for power / voltage changes. I'll check it in the morning and see if it's failed again then start enabling things one at a time.
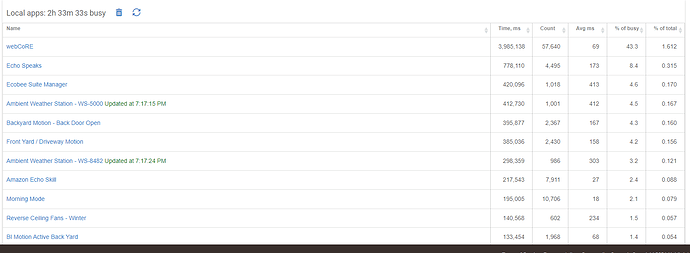
It sounds like you've taken a look at Runtime Stats, but other than Ecobee and Echo Speaks, it's not clear what you found there. Anything with a high "percent of total" would be my first guess (or percent of busy, though that is not necessarily a problem if the hub isn't super-busy), or really anything with large numbers anywhere, though again that doesn't necessarily mean it was the problem--just something you can use to make better guesses.
Scanning your past logs for errors or other suspicious activity might also be a good thing to try, and I second the advice above to look for drivers that make lots of HTTP calls (Ecobee was probably one?) or chatty devices in general, like Z-Wave switches/dimemrs/plugs that do power metering, many of which have options to turn those reports off or tone them down.
WebCoRE has also been historically problematic for some people, though I'm assuming you're using the recent-ish fork (a couple years ago, maybe?), where I don't think I've seen those complaints and staff have not formally recommended against running it as they once did. Custom apps or drivers could also be suspect if they were written in a problematic fashion, but that would probably reveal itself in the runtime stats, and I wouldn't start off by accusing anyone of that. 
1 Like
Well, webCoRE shows around 32% busy but I'm not quite ready to disable that because it's almost all of my automations. Under device stats my thermostat shows around 20% busy so I've disabled that for the time being. I have no idea why it would be so busy. Past logs don't really show much around the time the errors occur. It's usually just normal stuff like a light coming on because motion was detected.
I'm not sure what state sizes are or how they would affect hub operation but all of my Echo devices have HUGE state sizes... exceeding 10K.
I have 1 over 10K, with the others averaging around 8K, so not too outrageous.
Is that % of total or % of busy, and what is your busy % (Local Apps Total Busy/Hub uptime)
That's % of busy. The % of total is less than 2.
Local apps total is 2 hours 5 minutes and hub uptime is 2 days 12 hours and 40 minutes. I did reset the totals about 12 hours ago after disabling some apps to get a better idea of what's going on.
So your hub is only showing ~3% busy from the App side, what's the device tab look like - Total Device Time?
Device load is almost non-existent based on that screen shot...
Yeah, and the strange thing is the severe load errors usually show up when no one is home... when there is the least amount of hub activity.
Here's a screenshot of the app stats:
Not seeing anything out of the ordinary there either. CPU load is generally the sum of the processes that are running plus those that are waiting for a response (generally I-O or async calls). Given what you've shown so far, I'm guessing we're looking for an application that is generating a lot of async HTTP traffic, and not getting an immediate response.
Everything that generates HTTP calls has been disabled. That would include Echo Speaks, Ecobee Suite, Ambient Weather, Amazon Echo Skill, NOAA Alerts, and Blue Iris. I also have one webCoRE piston that hits an API... and I disabled that as well. It only runs at midnight and according to logs it never fails to receive a response.
I think I've narrowed this down to a handful of Iris outlets using a custom driver. I've reverted them all to the generic Zigbee outlet driver and the issue has went away... at least for the time being.
4 Likes


