Are you saying a minimum of 1 minute or you recommending a one minute for everybody? Mine is currently set to 3 minutes should I move it to 1 minute?
yes - set to 1 minute and let me know if things work better for you...
@bravenel : Any intent on fixing this? This address (http://192.168.xx.xx/logs#device-stats-panel) no longer leads where it's supposed to.
The right page is /runtimeStats#device-stats-panel.
If there's a link to the old page in 2.2.7 somewhere, it has definitely been fixed in upcoming 2.2.8.
OK. However,there's also the matter of accessing the page where one gets to override events history max size... As long as there's no alert on the main page, there's no way that I could find to access this page without knowing the url... Seems pretty messy to me.
If you do a search or ask around here, you’ll find that many of the endpints are known.

(apologies @thebearmay)
1 Like
Has anyone noticed a significant drop in their cpu of the past few days, only thing I've done is upgrading the c5 to latest version, c7 still on the old version. But they both have dropped about 0.1
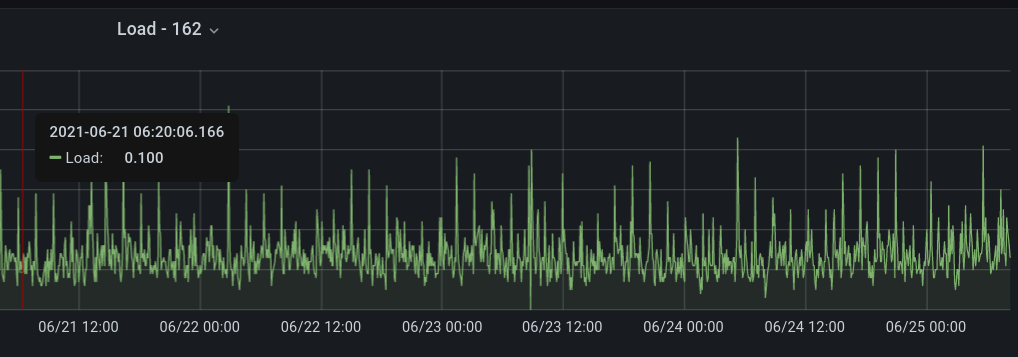
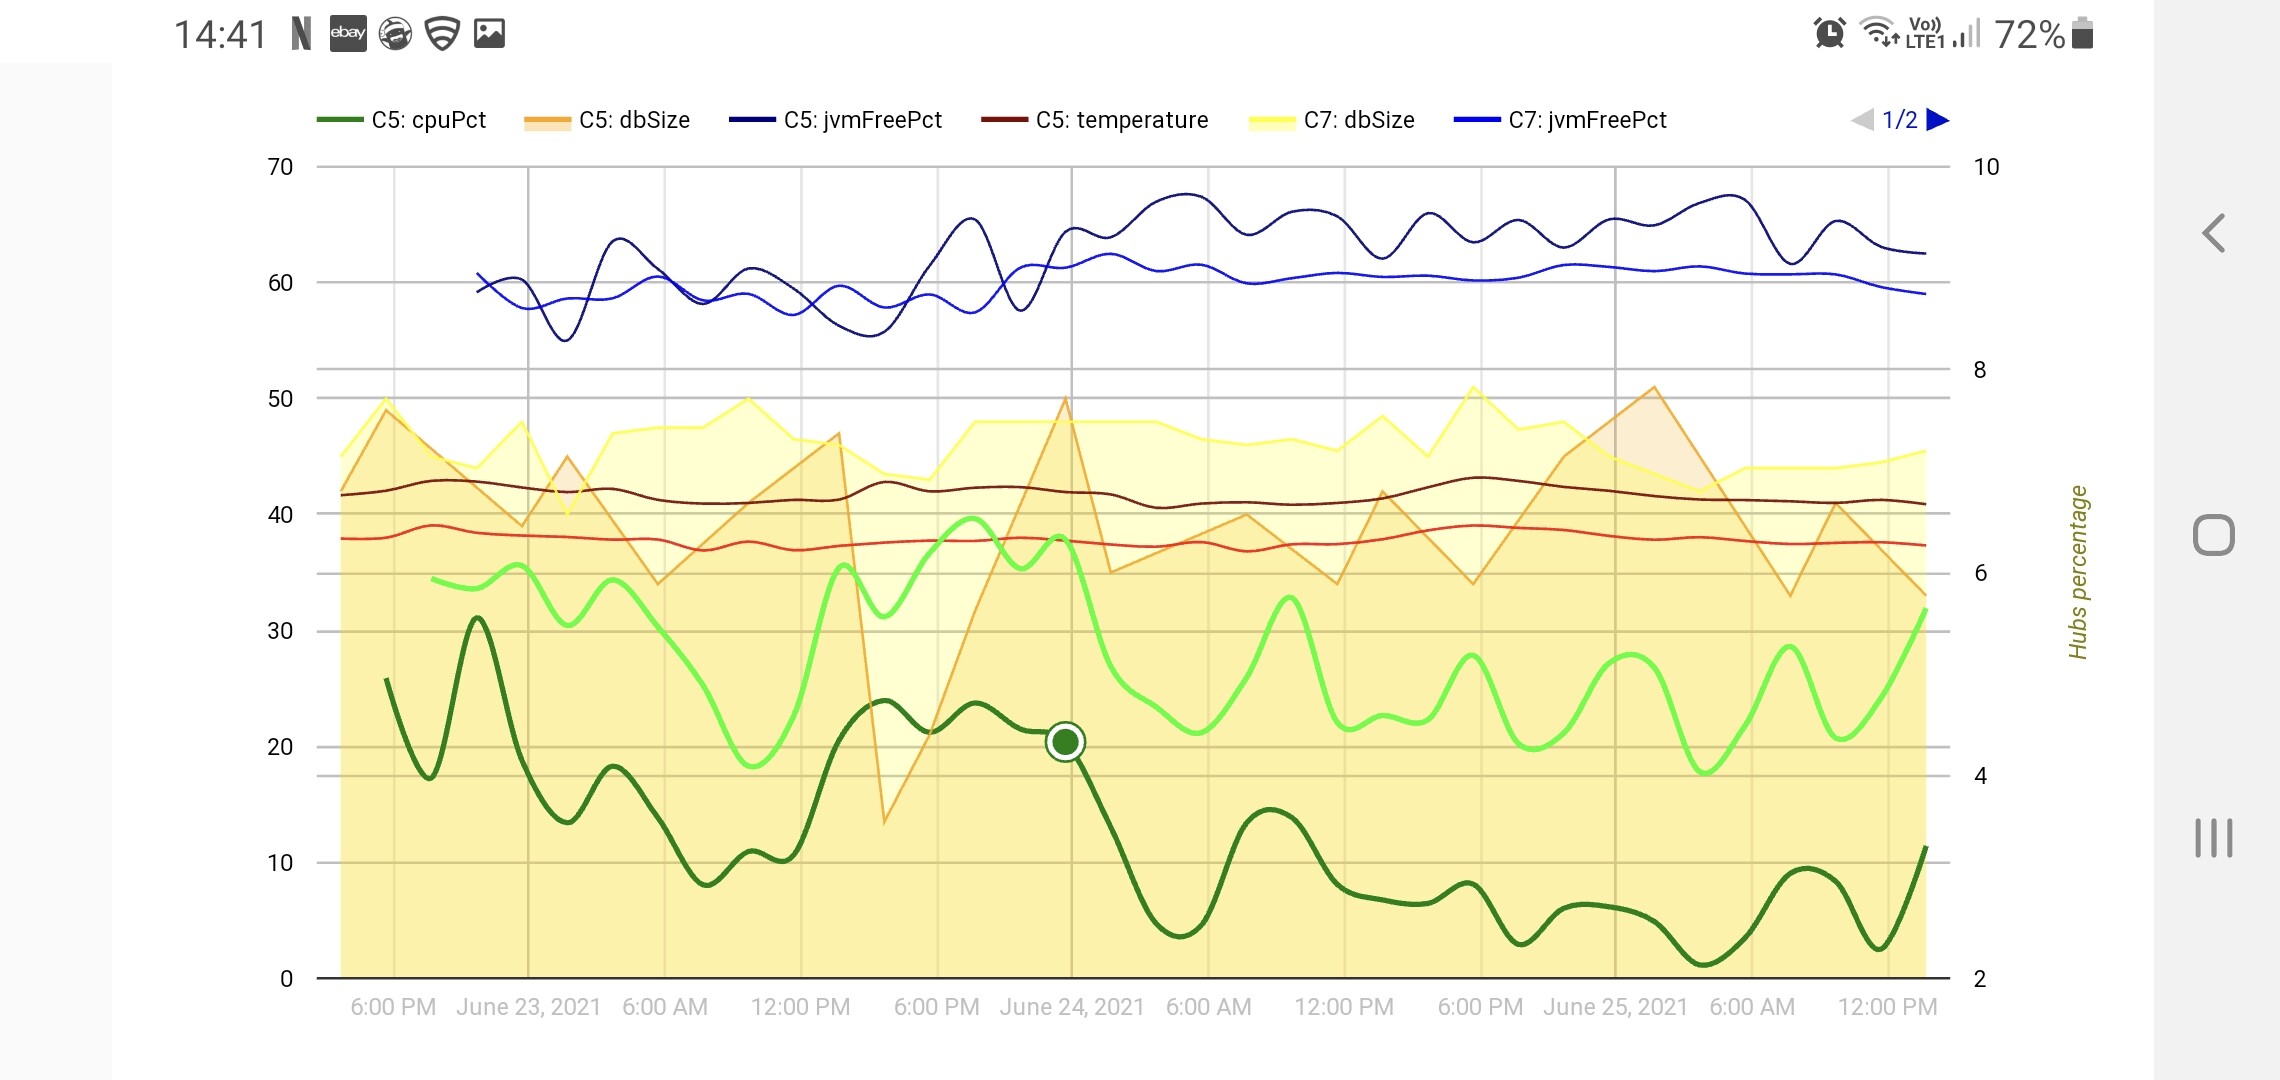
I have noticed that my hubs (both C-5 on .228) are running faster than they ever have.
It’s been like this since the update. Maybe some magic sauce @gopher.ny added? Hub Mesh?
2.2.7 alternates between database defrag and compact when rebooted. Two reboots should get database into top shape and running better (as long as it's not corrupted).
9 Likes
Looks like this is exactly what I was doing here...
Is setting the polling time still true as the fix? I am running the latest version of ES, it does seem like everyone week or so I get thrown a severe CPU notice.
Odd - I don't see these errors on any of my installations, even the one with 3 Ecobees and 12 sensors on a C5.
- What version Hubitat firmware
- What version Hubitat hardware (C4 is probably too slow for Ecobee Suite, unless you are willing to live with the occasional error)
- What version Ecobee Suite Manager, Ecobee Suite Thermostat
- What is your polling cycle (yes, it should be set to 1 minute if you are seeing these errors)
- [edit/add] What are your Event and State history sizes for the Ecobee devices (I recommend setting both to 11 to keep the DB load low)
I am running firmware 2.3.0.120 on a C7 hub.
Suite version 1.8.53
Thermostat version 1.8.22
The only thing I’m using the suite for is to set program modes based on hub mode,
I set polling time to 1 minute and have so far been ok. Been keeping an eye on 5 minute average CPU which holds steady at about 1%.
My event and history sizes for my thermostat and five sensors are 20 and 30 respectively. So I’ll try turning those down.
1 Like
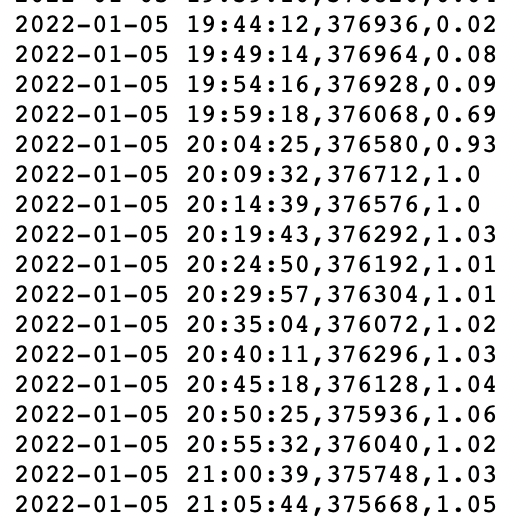
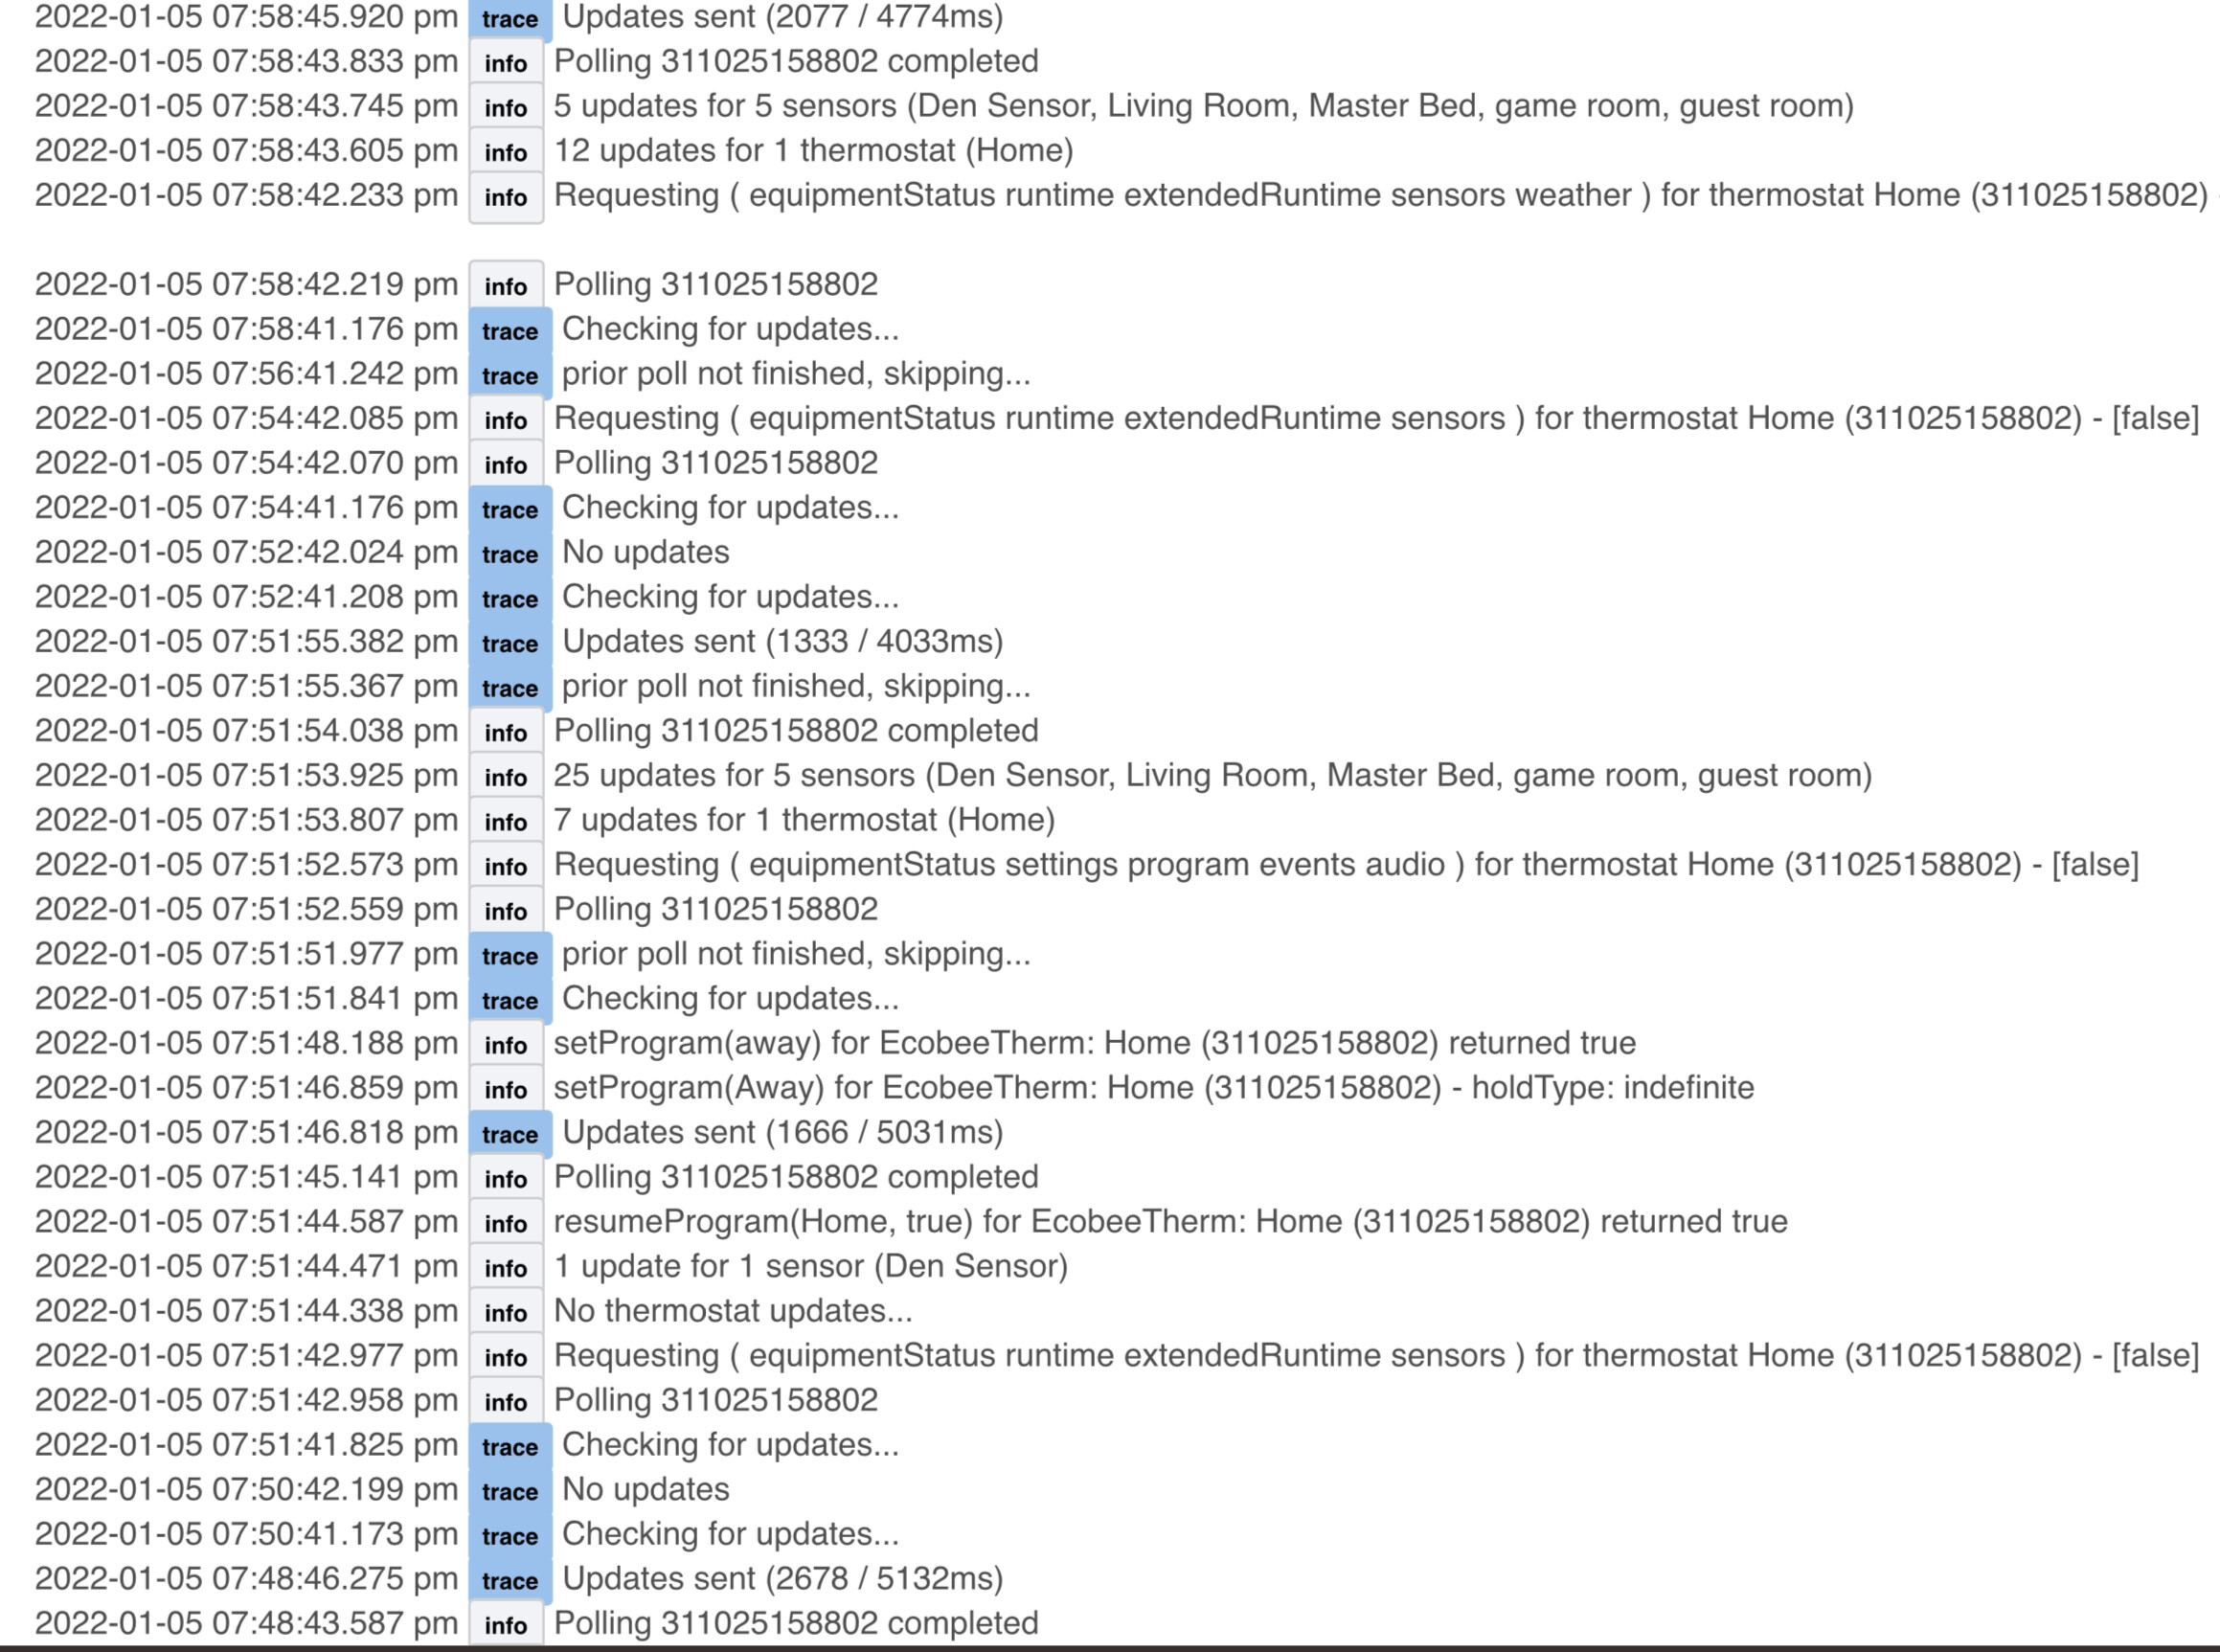
So interesting enough, I still continue to get random climbs in CPU. This does not always result in a lockup or a CPU alert, but it does seem once it jumps, it will stay that way until hub reboot. Disabling apps does not appear to bring it down, only reboot, I have been ringing my head trying to cross reference logs across my system with the CPU climbs. I did find in the logs for Ecobee suite several traces of previous polls not finishing at the same time the CPU climbed. Now I did accidentally have two minute polling instead if one, which I just corrected and rebooted my hub. I’m certainly not trying to point fingers at any one app, but it is interesting to see this in the logs unique to the CPU climb, would you take a look at the screen shots and see what you think? Maybe I’m on the right track here,,,, at 7:58, it gets a sizable update of 12 across the ecobee devices, Between 8:04 and 8:09, the CPU levels out and holds at a pretty high level.
Wouldn’t have thought a cpu load of 1 would trigger a severe load warning, as the HE is a 4 core cpu, ie a load of 1 is ~25% busy. Higher than mine normally run, but full throttle either.
Perhaps look at the scheduled jobs tab in the logs page to try and track down what may be running often enough to produce somewhat elevated CPU usage. Device drivers (including my own) can include scheduled polling of remote devices / services that could be consuming resources...
Like @thebearmay mentioned, the CPU usage is not particularly high given the capacity of the hub. Are you seeing other symptoms of degraded performance? Or just the numbers are concerning you?
For what it’s worth, any hub running a high volume of http traffic will see a slightly higher load value because the load value includes processes that are in a wait state, i.e. http get/post response cycle.
3 Likes

