Booo Hiss .. LOL
But thanks for the response ![]()
1 Like
I’ve decided to give this app a try today. I do most of my hobby work on the iPad with the Magic Keyboard.
Unfortunately, from what I see, the left menu page requires an Esc key to show/hide, which I don’t have on this device…

Could another option be added? I can test out ideas if you’d like.
1 Like
You can swipe from the left margin to the right to reveal the dashboard menu.
1 Like
Ah! Yes - Thanks! That worked. ![]()
Quite an impressive app!
1 Like
I’m also noticing that moving and resizing the dashboard tiles with the touch screen doesn’t seem to work. I do have a « Magic Keyboard » that has a track pad, and it does work with that. I think this is a common issue on web pages - not sure that there is a solution…
1 Like
Thank you ![]() . It should get better once more datapoints are collected; give it a week or two, and you can start spotting trends and patterns.
. It should get better once more datapoints are collected; give it a week or two, and you can start spotting trends and patterns.
You are right, that's why I disabled this functionality on mobiles. I'll see what I can do to make it better.
1 Like
That is amazing! Working on implementing already -- Thank you!
I have to say that after only a few days, it is already looking great!
One thing that I’m wondering - Is there currently a way to line-up the time on two separate tiles?
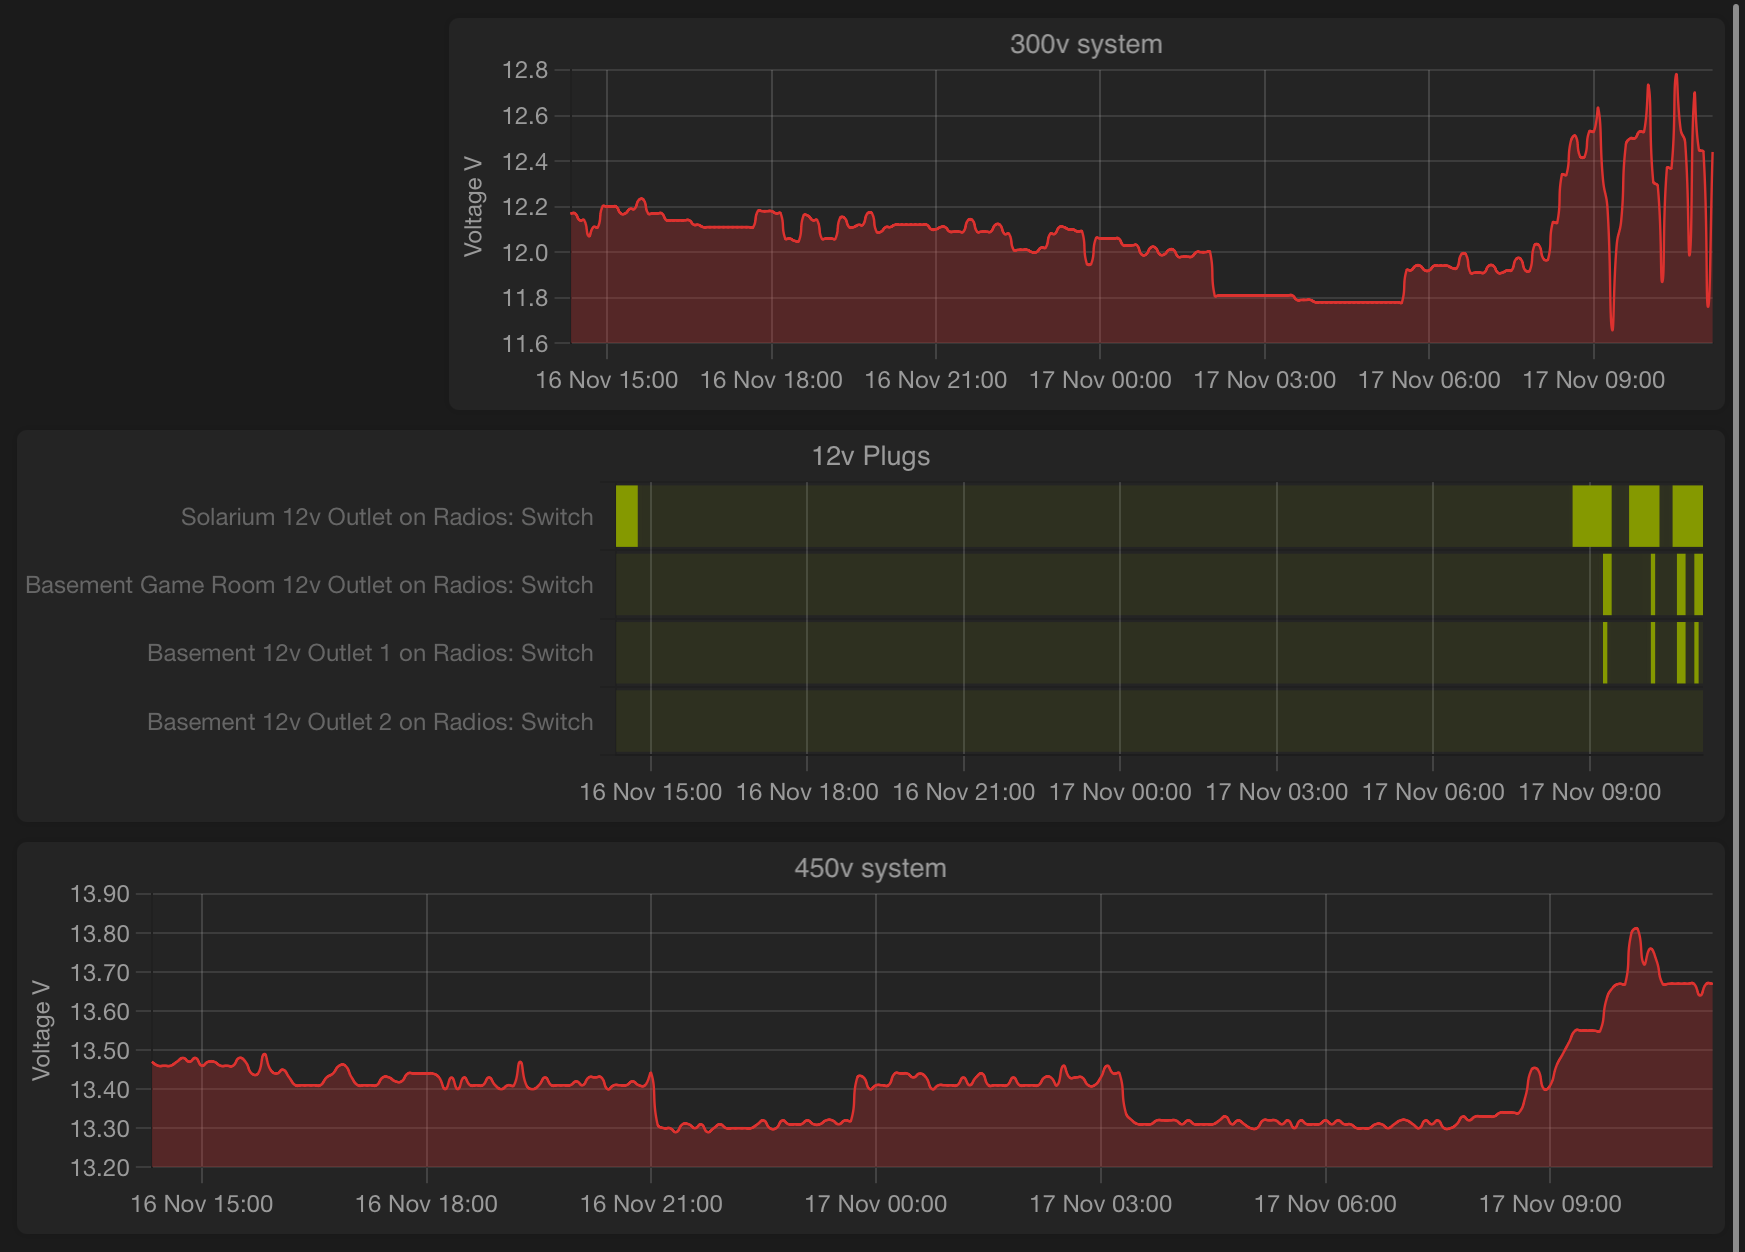
I’m using this to keep an eye on a small solar array that I use to charge batteries and iPads. Hubitat automatically turns on 12v to USB devices, and I like having the ability to see what was on when. I would love it if I was able to link those two together, maybe with an option to have the series’ text moved to within the graph (circled below), or rename the series?

For now, I am working around this by pushing out one of my graphs (which looks a bit odd):
1 Like
Unfortunately there is no way to align/compare 2 tiles. I was thinking to add a linked crosshair on all tiles, so when you hover over a chart, the red line will move in sync on all other tiles.
4 Likes
Well, that sounds like a nice addition!
1 Like
Thanks for a great app!
I updated to version 2.3.0 today, and I noticed that stored switch attribute values are now limited to the range of 0 to 1, instead of 0 to 100. Was that intentional?
1 Like
Thank you for reporting this!
It is a bug, a quite embarrasing one; I lost a couple of zeros in the calculations. This will mess up the metrics of non-numeric attributes for a couple of days. Sorry about this!
I'll come up with a fix, first thing tomorrow.
Released version 2.3.1 with the following important fix:
Fixed
- Values for non-numeric attributes are capped at 1% - @tj4293
This bug was introduced in version 2.3.0.
If you updated to to 2.3.0, it is highly recommended to immediately update to 2.3.1.
Have fun!
2 Likes
@dandanache,
Thanks for another great update!
I currently have a 7 days max records with 5m accuracy.
Just wondering if it is possible to have another box similar to "view data with xx precision" to view data for the last 1h, 6h, 12h, 24h, for example. This will make it really easier to view the data specially on a mobile device by clicking the desired data period without using the mouse or fingers. Thanks for considering when you have some time.
1 Like
Released version 2.4.0 with the following small addition:
Added
- Sync crosshair between all dashboard charts - @Sebastien
Have fun!
4 Likes
The crosshair sync is a great addition!
I have two suggestions regarding enhancements to this feature:
- Make the sync optional (enable per tile, default enabled?).
- Add the ability to also sync the zoom position (optional per tile, default enabled?).
2 Likes
Wow! That’s very nice! Thanks! ![]()
1 Like
Could one create a virtual device which does a facade/interface on top of non standard attribute names?
I'm not sure if virtual devices allow for that sort of pass through data access where all we want to do is map an attribute name.
1 Like
Does anyone know if it's possible to pull values from virtual device? For example, I use sun calc virtual device to track azimuth and altitude of the sun which I use for various automations.
I would love to be able to show the values from this virtual device on the dashboard, but it doest seem to see them as valid values
1 Like
The app can pull data values from virtual devices, but only from the supported attributes.
Possible workarounds for non-supported attributes are:
- Edit the Watchtower app code and add your desired attributes to the SUPPORTED_ATTRIBUTES map at the very top of the file. You will have to re-apply your patch after every new release of the app.
- Add a virtual device that has a supported attribute, and create an app (in Rule Machine) that copies the value of the non-supported attribute from your original device to the supported attribute of the virtual device. The data will have the wrong label in the graph, but it will be visible.
3 Likes