Dan - that works perfectly! Check it out...
Thank you!
![]()
Appears to be due to bot/human detection.
I see you have provided a auto or fixed y-axis scale setting, but is there a way to actually set the y-axis scale?
When I chart several different temperature or humidity sensors for instance, the scales for each sensor is not always the same so trying to compare them is very difficult.
Also, I have tried to determine how to add a chart to a HE dashboard and I am sure it is easy for some, but for me, being dense and not a deep software guy, I cannot figure it out.
Any assistance would be great!
Also adding a chart to a HD+ for android would really round out this app's usefullness!
Thanks!!!
EDIT:
OUI VEYH!!! I was still on 3.0.0 and HPM never picked up the newer versions!!!!
NOW I installed 4.0.0!
Is there a way to "import" my graphs from 3.0.0 so I don't have to re-create them?
If not, then I will just churn through them again.
Q: why didn't HPM see the newer version? hhmmmm....
You are right, this is possible but not documented anywhere. I'll try to update the readme file to include instructions.
This has been discussed before in this thread, and a solution was recommended. It was my fault cause O moved the source code from Github to Codeberg.
There should be no need to import the graphs if you update the app. If you created a new app instance (and removed the old one), then the import is sadly not possible and you may have lost both the graphs and the data.
Can you load and view that URL in the browser?
Thank you for the quick answers!
I thought I looked for the other part of this thread about HPM and updating, but I went ahead and started over with the newer version.
Yes I had to re-create the dashboards, but there have been other changes and needed to be cleaned up anyway. Not a big problem!
This is a VERY nice app and really is "better" than some of the others for both a quick and a permanent graphing solution!
Looking forward to learning about adding to a dashboard and HD+ android dashboards!
Thank you!
I update the documentation: Embedding Watchtower Dashboards in Other Apps
Hope this helps!
THANK YOU for your effort and help!
I will take a look!
WORKS like a DREAM!
Thanks!!!
HHMMM strange thing happened though.
I tried it on my Galaxy S23 ultra and it worked GREAT!
But I tried it on my Fire HD10 tablet and all that happens is I get a tile with a rotating circle and no dashboard.
All my other HTML tiles are working, like gauges, but this doesn't for some reason.
Obviously something to do with the tablet, but I don't know.... YET!
Yes, that's how I saw that bot detection was enabled.
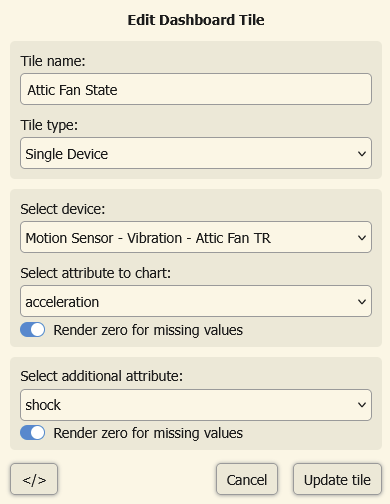
I'm using Watchtower (one of my favorite apps!) to track the Active/Inactive state of a ThirdReality vibration sensor attached to an attic fan. That device shows Current States like this:
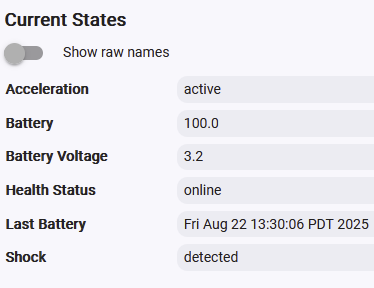
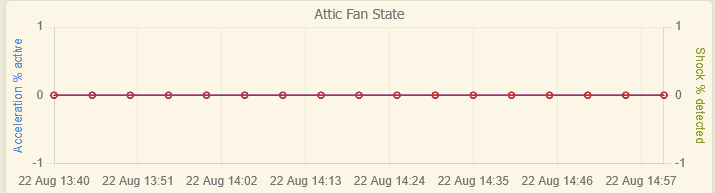
My dashboard tile settings are imaged below, as is the output graph (during the illustrated period, the vibration sensor had acceleration = Active and shock = Detected).
My questions:
Nevermind! The anomaly I was seeing appears to have been an artifact of the driver I was using (Tuya Zigbee Vibration Sensor). I switched to the ThirdReality Vibration Sensor driver, and now I get 0% or 100% readings for acceleration (no shock parameter anymore) and the Y axis is now correct.
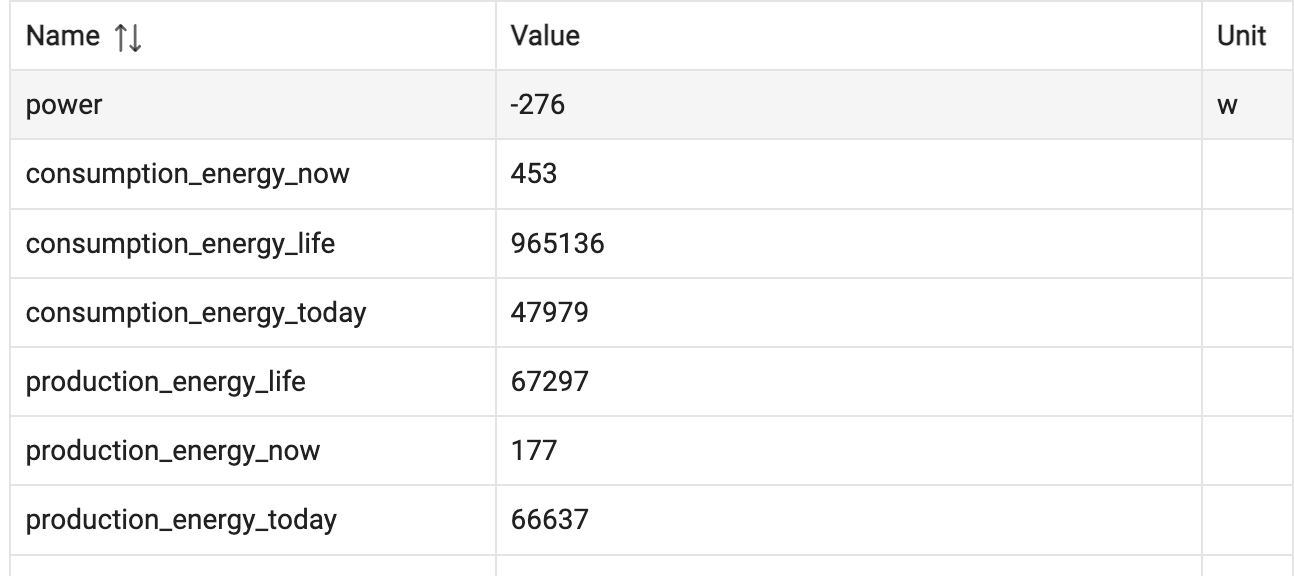
I have got my solar system up and running, and am using the [RELEASE] New Enphase Envoy driver supports token based authentication driver to pull info from my solar system. This gives me information via the "power" object, which I'm able to consume in Watchtower, but I was hoping there was a way to graph and plot some of the additional (custom) fields.
So the question is, is there any way to consume these datapoints into Watchtower? I'm thinking if I had a Rule to copy the values into a custom variable or some sort of solution such as that - would Watchtower be able to read a variable?
A custom variable would be nice, as it would allow math calculations to take place before graphing into Watchtower.
If not, is this something that may be available in the future?
thank you!
There are 3 ways to graph custom attributes:
Don't use custom attributes ![]()
Ask the driver developer to stick as close as possible to Hubitat's way of doing things. In your case, the device should have 2 child devices "Production" and "Consumption", each child device should implement EnergyMeter and PowerMeter, e.g. have the energy (in kWh not Wh) and power (W) attributes. The driver should probably be distributed using HPM to make it easy to install the two required drivers code (1 parent, 1 child).
This is the preferred solution since it follows the standards and also allows you to use these devices with the new EZ dashboards.
Modify the Watchtower source code
Add the following lines in the "// Non-standard attributes" section:
consumption_energy_life: [min:0, unit:'Wh', minMax:false, probe: { device, app, events, begin, end -> calc5minIncrease(device, app, 'consumption_energy_life') }],
consumption_energy_now: [min:0, unit:'W', minMax:true, probe: { device, app, events, begin, end -> calc5minAverage(device, app, 'consumption_energy_now', events, begin, true) }],
production_energy_life: [min:0, unit:'Wh', minMax:false, probe: { device, app, events, begin, end -> calc5minIncrease(device, app, 'production_energy_life') }],
production_energy_now: [min:0, unit:'W', minMax:true, probe: { device, app, events, begin, end -> calc5minAverage(device, app, 'production_energy_now', events, begin, true) }],
// For energy like attributes (ever increasing), you may also want to convert from Wh to kWh, since its easier to reason with these values
Disadvantage is that you need to add those lines back to the source code after an update of the app. But the app is pretty stable right now and no such updates are planned in the foreseeable future.
Use virtual devices
Create 4 virtual devices with type RM Connector Variable, each having one single attribute named variable. Use Rule Machine to populate the values and add the 4 devices to Watchtower.
I don't really like this because it involves a lot of work and adds tight coupling between different components: real device -> RM -> virtual devices -> Watchtower
Hope this helps!
It is unfortunate that Codeberg uses bot detection on raw URL's that are usually consumed by scripts.
Found another way to expose the raw code. Does this URL trigger the same bot detection?
Thank you - for now, Option 3 is what I've gone with (and yes, not ideal). It's a handful of additional devices, variables, and rules - but it gets the job done. Probably some extra load on the hub this way as well.
I didn't want to go with Option 2, as I don't want to make changes to code that may ultimately get overwritten with a future version, but yes - that's clearly the best path.
If I had a request, it would be for you to create a device "Variable", which can then present the variables into a Dashboard. It would need the ability to set a Label (name) and type (ie, power meter) for each variable you read in. But, Option 3 does the trick and eliminates the need for this - with just a bit of extra rules.
Thank you!
You can do that using User Scripts. More work for you, but seems like you are poised to take the grunt-work path anyway.
@dandanache Is there a way to force the Y axis scale.
I have 4 different sensors that log temperature and I am trying to compare them in a graph, but when I generate the graph, each sensor's Y axis is a little different, even with fixed selected.
I have tried to locate any clues or answers here but have come up empty handed, hence my question.
Thank you!
You can select multiple devices on a “single attribute “ tile type to compare values on the same scale.
Thanks for the tip!
Worked great!
Now I would like to set and fix the Y axis scale rather then have it auto scale.
Download the Hubitat app