I'd like the same thing, as my Energy data isn't MI (NEM/Solar), with the Device values representing the net-consumption and/or generation at each sample throughout a day.
My energy (and power) values come from my Smart-Meter, using a Rainforest Eagle [RELEASE] Rainforest Eagle
Seems like there are a few challenges with the use of calc5minIncrease for aggregations on energy values, and Average for most other things.... not clear on why this is different...
@dandanache was it intentional for WT to store delta-energy values, and/or can it be changed to be like [most of] the other average-attribute values?
Summary
Solar/NEM energy data gets unexpectedly altered in WT.
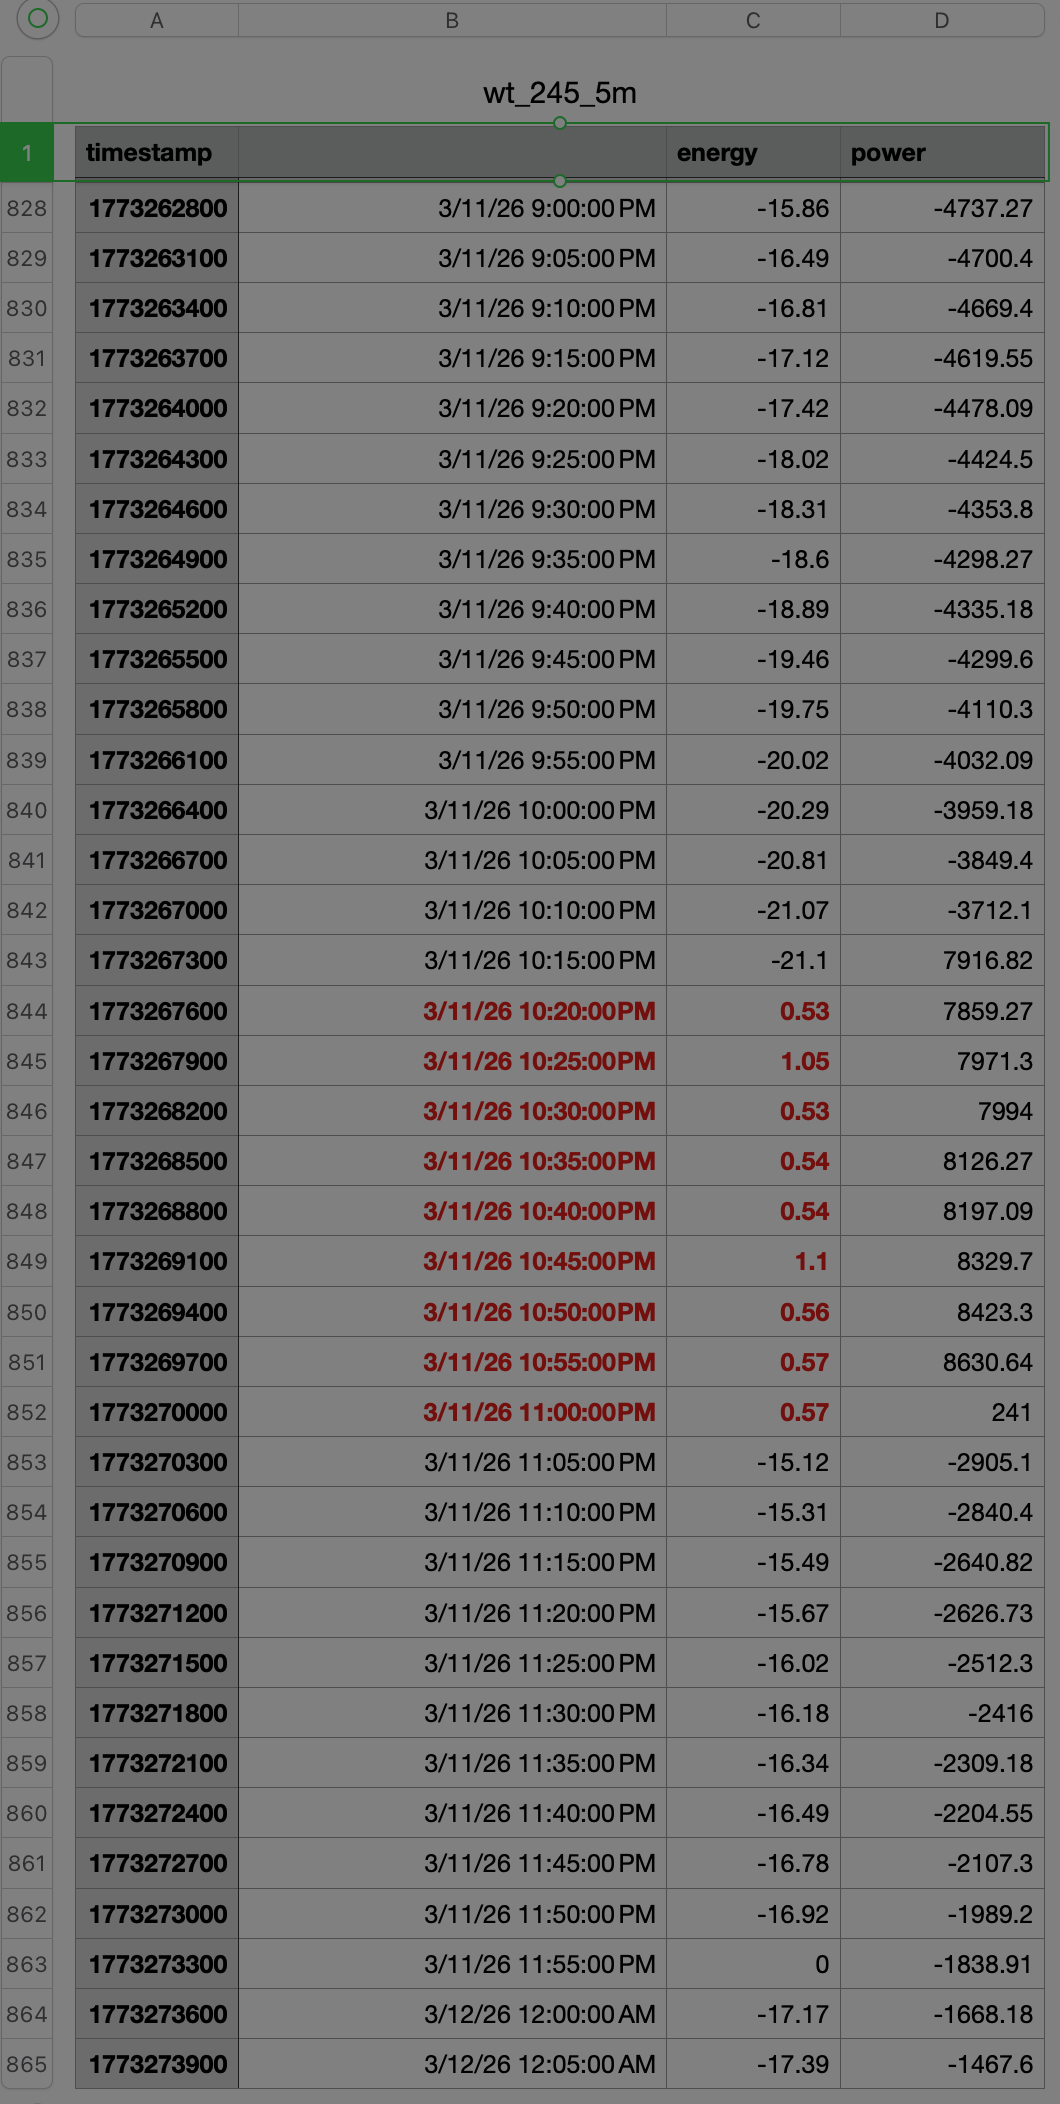
I've included the raw Energy values for my Device, and the resulting WT aggregated data (5m) and the corresponding graphs.... definitely a whacky visual for energy values that are already cumulative.
You can see the discontinuities happen at the transition points in the dataset (see RED bit, as a midday-example)
Original values from the Smartmeter Device, changing every 4m:

WT values aggregated, changing every 5m:
The unusual energy graph from the WT values:
