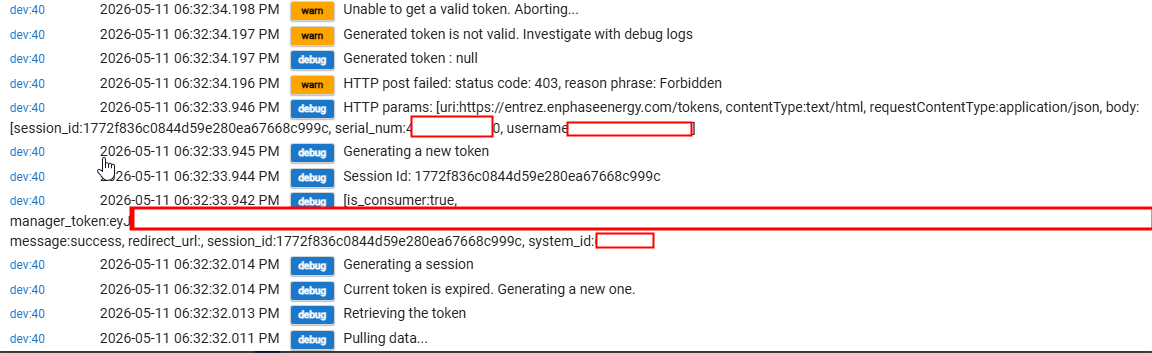
If you're able, it would be a good idea to update the URL in the initial post from this thread, as it points to a dead link. BTW, thanks for this driver, I've been using (my hacked version of) it for a year, feeding the results to InfluxDB, and enjoying my Grafana graphs. But...
A few days ago some of my graphs flatlined. After some investigation, I found that my Envoy is now running a firmware build dated June 23 2026, almost certainly since a pair of reboots on July 29, which I suspect correspond to an over-the-air-update from Enphase. I queried the Envoy manually, and discovered that it is now feeding me garbage data on /api/v1/energy, where numbers remain unchanged over time, hence the flatlined graphs. This remained true even after I cold-booted the unit; it seems to me that some of the APIs got broken in the recent firmware update; is anyone else seeing this? This is an Envoy IQ with software "D8.3.5433", release version "02.00.1785".02.00.1785.
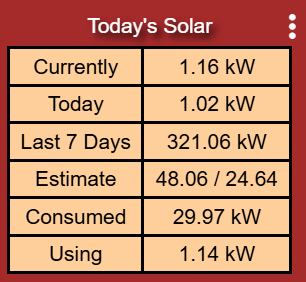
The unit itself is feeding correct data to the mother ship, as evidenced by correct-looking graphs when I consult the Enphase Enlighten web site. If I query the unit using /production.json, I still get some nonsense data (for production, whToday, whLifetime, and whLastSevenDays are identical to each other, and the same is true for total-consumption), but wNow values change over time, so they may be okay. I'm not sure if any of the aggregate data are correct in any of the API endpoints, but for my purposes I use only the point-in-time data, so if I can modify the driver to use an API endpoint that shows correct data, I'll be back in business. (Also, some time ago I hacked on data collection per-panel, and that still worked fine, which clued me in to the type of problem I was seeing.)
Anyway, I wonder if anyone else is seeing this (likely) firmware bug on the Envoy IQ, and if so, whether you're planning to re-code for it, or whether I should just proceed at this end...