That would suggest that this app is only able to see the last few hours from HE for this specific device (unlike the other 2 you have on the graph).
So you'll just need to wait. You might also want to look at the "Long term storage" option for the graph if you are only seeing a few hours even after a few days pass, as that will keep more events around even if HE is clearing them.
thanks for the advise! I enabled long term storage...will wait and see
another question for developer of utmost low priority....but is there any way to skip the first part of the name on the Legend ..in my case Water Meter ...It would allow the remaining text to be larger and it would be clearer : )
Thx
In the config for the graph you can set that to be whatever you want. Look for Override display name on graph.
Thanks for pointing that out!
I now have bouncing balls saying drawing charts ....but never get charts...
this has happened before and i kept refreshing and finally got but would love to understand what is going on ..
thx Tim
I'm trying to make a Daily Forecast Tile using Weather Tile 2, but when I try to add the day of the week, it says "unsupported" instead of the day. Am I doing something wrong?
Edit: I also just noticed, the windspeed seems to be showing km/h with mph units.


Dang. You found an issue that I just found. I will be posting a minor update later this morning
Bouncing balls means something failed; check the logs. Sometimes the device has no values, etc. If it gets to Step 3, it is a Hubitat issue. Step 4 is (usually) a Javascript issue. Take a look at the logs and post what you see. We can debug from there....
1 Like
Small update to adress the "day" issue has been uploaded.
1 Like
I think I don't understand this field....i was setting to no selection ... (which I think was causing the bouncing balls)
thinking back to my calculus days I was thinking that I don't want the data integrated....
Any clarification on this would be very helpful

Got it; Probably due to an update. This field was added to "deal" with multiple values over the time interval (this is selectable in the options). Average = the Average of the Values. Min = Minumum. Max = Maximum. Many have asked, "Why do I care". I use MAX for wind gust. I use AVERAGE for temperature. etc.
A few people want to keep the data "raw", unfortunately, the chart will AVERAGE anyway based on the number of available pixels.... this solution gives a better balance of control and "just live with whatever the idiot programmer implemented"
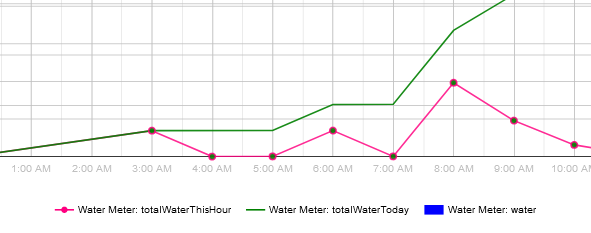
so if i get 3 water readings of .5 wouldnt I want it summed ? otherwise I see the value .5 when I actually had 1.5 gallons ...
thanks for all the help !!
No one has requested a “sum” operation; easy to add  while I am in that part of the code, any other functions you suggest for multiple values over the time interval?
Thanks for adding..sorry to be clueless...but I will lose information without sum, right ?
I can't think of any others....
the water meter reports every minute although I accumulate until I have a report of 0 ... if I wanted to see each nonzero reported value ...would I reduce the time interval to 1 min ....and is that a bad thing
THANKS so much !!
Yes; reduce the time to "catch" each event and NOT integrate. Here's the thing, depending on your reporting interval, the graph (Google Charts) might average two data points together. Just make sure your display has enough "pixels" to display the full graph. I just finished an update to Weather Tile 2 (it enables night icons). I will address the sum in the next hour or so. With that update, you should not "lose" any data.
TOO LATE RESPONDING: The work is done. If you update Hubigraphs the "sum" option is now available.
Thanks !!! Also thanks for using package manager!
I updated my app...will check it out
again thx
Hubigraphs "Long Term Storage" seems to crash upon invocation.
App sez:
An unexpected error has occurred trying to load the app. Check Logs for more information.
Error: Cannot get property 'date' on null object
Logs say:
(http://192.168.1.64/installedapp/configure/289)java.lang.NullPointerException: Cannot get property 'date' on null object on line 813 (longTermStoragePage)
This is consistent - every time I try to pull up Long Term Storage for ANY configured Hubigraph
Having problems with Weather Tile 2.0 after upgrading to the newest Hubitat version and the latest version of Hubigraphs on HPM. The Weather Tile was not saving edits after I made them in the UI. I tried removing and reinstalling. Now when I try to configure the weather tile, I get a "{"error":true,"type":"java.lang.Exception","message":"An unexpected error occurred."}" error in the configure tile widget. Thoughts?
Edit: I tried rolling back the firmware and restoring a database from before the firmware upgrade. No dice. (I was going to roll back anyway b/c of new dashboard link issue.)
Edit 2: looking at the logs, the problem seems to be with retrieving current.rain.1h; here's a typical entry: "current.rain.1h: Cannot find data: java.lang.NullPointerException: Cannot get property '1h' on null object"
Congratulations! you are the 10th person to identify this issue.
Seriously though, I am working a fix. What is happening is that one of your devices does not have the minimum number (2) of event for the timeframe of your graph. Adding error checking now.
1 Like

