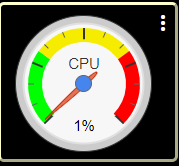
Multiple ways of generating graphs now-a-days, I use Grafana for most things, and have a couple of gauges and short term graphs in webCoRE (I already had a long term storage and graphing option in play before the capability was introduced to webCoRE) .

There's also [Beta] Quick Chart - Chart your data, quickly and easily, which I haven't played with yet as well as a few others. For each you will need to answer a few questions:
- Data source
- Quantity of data needing to be retained
- Data stored on hub or off
- If data not stored on the hub what transport do you want to use
So, what pieces do you have in place, and what tool(s) do you want to use?

