any idea what this error is, ive just migrated to c7
and * cpu5Min : 0.0 * cpuPct : 0.0 are sticking at 0
any idea what this error is, ive just migrated to c7
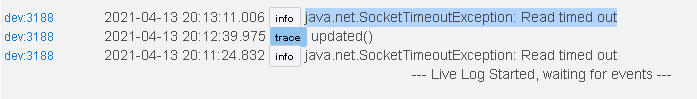
CPU numbers won't be available until a little over 5 minutes after rebooting the hub. Socket time out is interesting, haven't seen it before but is saying that the request timed out without a response IIRC. It's coming from the public IP request (may also show up as a status 408 error) so I wondering if we're overloading the site we're using to get the IP.
I upgraded this driver this morning and then hit this error:
[dev:1539](http://hubitat.local/logs#pastdev1539)2021-04-19 08:23:56.221 am [error](http://hubitat.local/device/edit/1539)org.codehaus.groovy.runtime.metaclass.MissingMethodExceptionNoStack: No signature of method: user_driver_thebearmay_Hub_Information_1249.getTemp() is applicable for argument types: () values: [] Possible solutions: grep(), getAt(java.lang.String), grep(java.lang.Object), getClass(), dump(), every() (getTemp)
I'm on a C5 with the latest fireware.
Anything I can do to help you?
There actually may not be an issue (other than the fact I forgot to handle this smoothly). Last version update renamed and restructured a few internal methods including getTemp. If you had a pending refresh for getTemp it would have errored out. Check the bottom of the driver for a pending job for the method getPollValues if you don’t see it and have polling enabled, hit Configure and it should appear.
I've been seeing CPU results consistently above 100%, sometimes up as high as 170%. Is this possible in terms of the reading you are taking? Assuming it's not in the terms of use of the CPU, but could understand if some calculations produced this result, just thought I'd check...
A CPU load of 4 (1 per core) would give you a 100% reading. If you have jobs queued up waiting for I/O or an async operation to complete your load can exceed 4 and thus exceed 100%.
I have increased the frequency of the polling for some of my wifi devices, so that could make sense. Thanks.
Thank you. Looks like that was it, somehow lost the schedule after the driver update (or after that error). Just FYI - I had to hit "save" to get a new future schedule setup as "configure" didn't kick off the scheduler.
The error (mine) breaks the schedule - reschedule cycle, so nothing you did wrong. I'll have to look to see if there is a clean way of correcting on an upgrade.
I just pushed 1.9.2. Functionality wise it is the same as 1.9.1 but automates the getTemp to getPollValues method schedule replacement to eliminate the error found by @SoundersDude and resultant need to re-save the preferences. If you are already on 1.9.x, this release can be skipped without any loss of functionality if desired.
I just pushed 1.9.2. Functionality wise it is the same as 1.9.1 but automates the getTemp to getPollValues method schedule replacement to eliminate the error found by @SoundersDude and resultant need to re-save the preferences. If you are already on 1.9.x, this release can be skipped without any loss of functionality if desired.
Repost of 4/20. Hate it when I accidently hit the delete button .
You can undelete.
How? I’ve never seen the option... Ah nevermind just found it. Was expecting in the Edit options. Thanks!
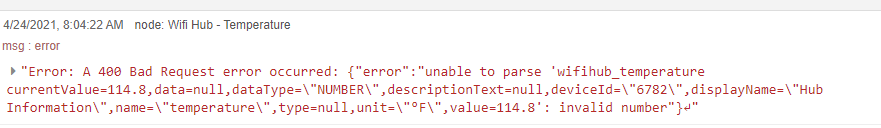
I'm using this flow and it's working but I get this error every 5 minutes.
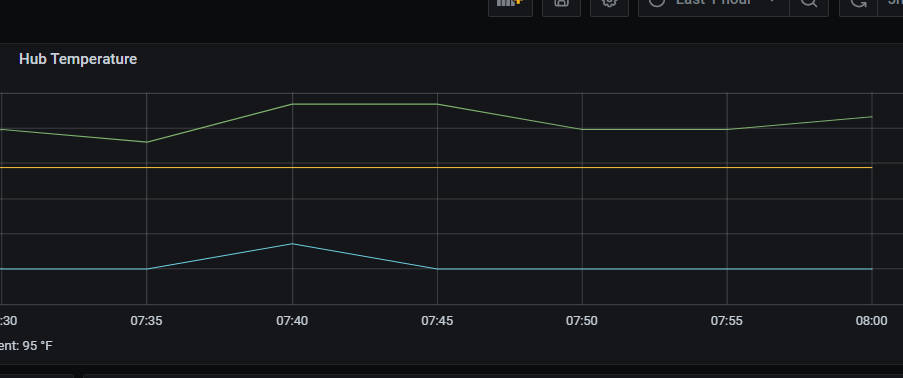
But it's obviously working because grafana is getting the information from influxdb every 5 minutes.
Any ideas on how to get rid of the errors in node red?
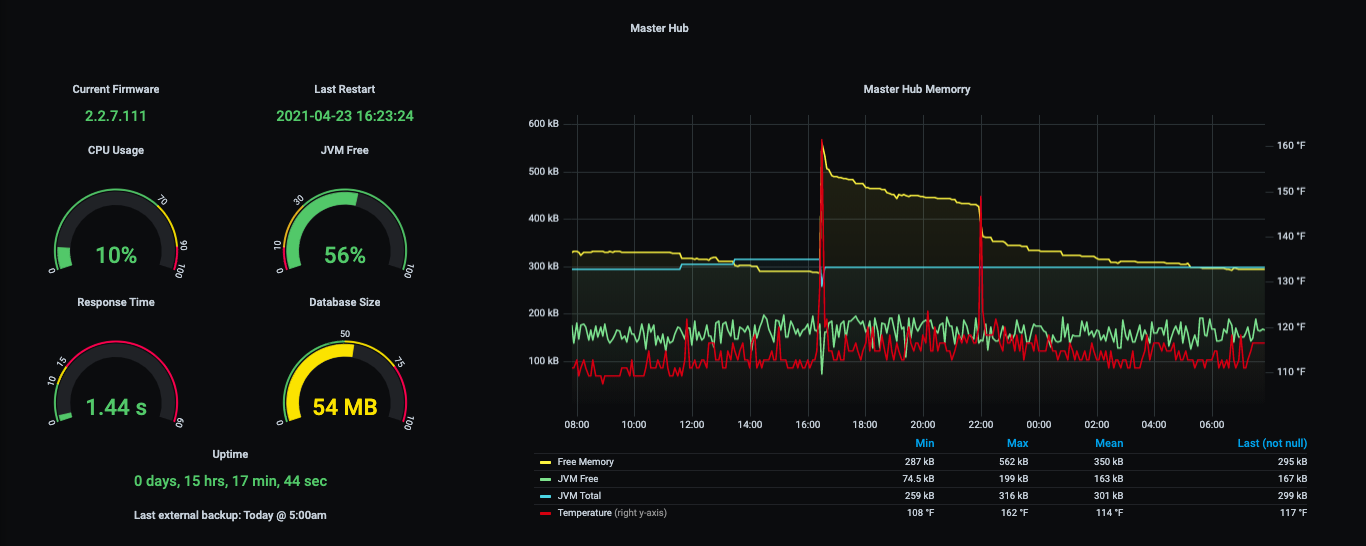
Not sure what's causing this error. I revised my flow to use events socket which is more efficient.
My dashboard has also changed.
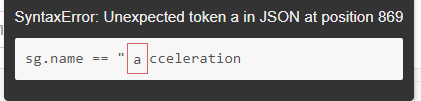
Getting syntax error when trying to import
From the invalid number message I’m guessing your flow is expecting an integer and is getting a float.
[
I'm a rookie at node red any suggestions on a fix?
For some reason when I copy the JSON to a post it messes up the file.
EDIT: Link removed
That imported fine, But I'm missing the filter node apparently and I'm not quite understanding how to use that flow like the other flow, (because I'm not that experienced with node red)?
Looking through that function node shows a bunch of sensor, thermostat, etc data? I'm just looking for the hub information data
The other flow is getting the data to influxdb, and reporting to grafana, I would just like to get the errors in nodered to stop.
Download the Hubitat app