pollen tile: add trigger image (grass/tree/weed) to today and tomorrow's pollen count
This should be fixed now
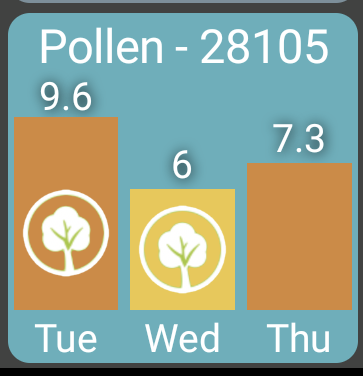
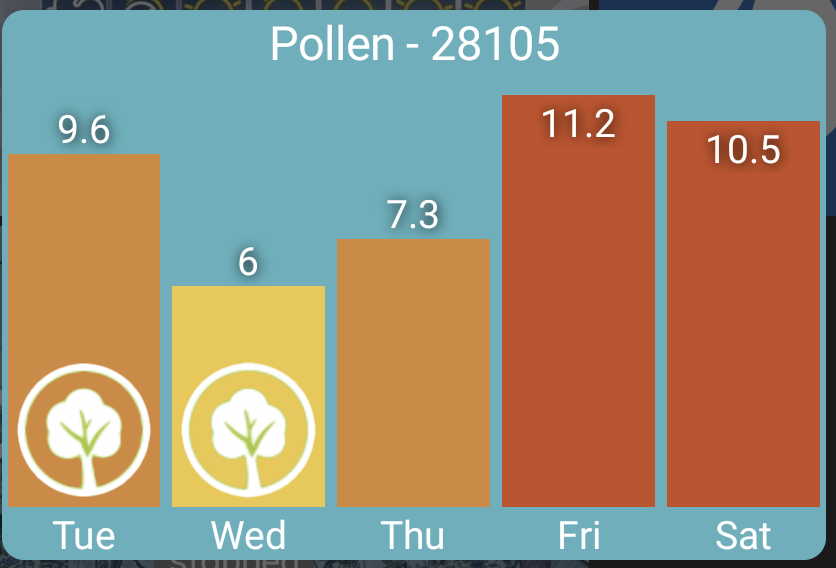
I also added a small change to the pollen tile - I'm already fetching 5 days of pollen data from pollen.com but now I'm also fetching the 'triggers' for today and tomorrow (ie: grass, trees, weeds) and showing a little icon for the top trigger. Not sure how helpful it'll be but I'll watch it on my tablet for a while and see if it's useful
As a side-note.. I see there's an asthma forecast which looks just like the pollen.com site. It'd be pretty easy to add an Asthma tile if anyone's interested in this.
oops.. I didn't see your initial comment about this. Actually, the app automatically changes temp by 0.5 degrees if it thinks you're in Celsius.. and maybe that logic is wrong.. basically if the setpoint you're changing is < 40 I'm assuming this is Celsius and using 0.5 increments.
Me too.. But I didn't even know you could change thermostat temp by 0.5 F.. I don't think I can with my Nest devices but guess I've never tried.. the Nest app just does 1 degree at a time
Well actually I am using the Honeywelll T6 stat controller app and THAT can change setpoints down to 0.1 deg F!.
Kinda overkill, but I use 0.5 deg sometimes with my Honeywell T6 scheduler app. Just a little nitpickey I guess?
hi @jpage4500 . I consider myself your apps biggest fan...
I use it everyday, all day and it just works for me. I'm not pushing it hard (ie; I removed camera's - they were overkill) but everything is just. smooth!
So... of course the tinker in me came out. I've a topic I'd like to broach and a question as well.
The topic.
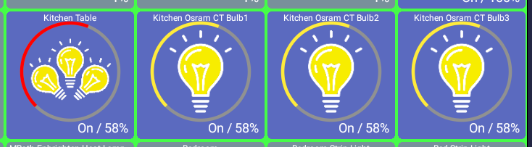
I recently customized a couple icons so that at a glance, I could find the tile for groups of bulbs easily. Here's a snap:
What I'm wondering is how would I implement a z axis tile? What I mean, more clearly I hope, is that in the HE Dashboard, one of the 'tricks' is to use multiple tiles, overlald on each other to give a single tile but with multiple tile sources.
Take the 'group' icon in my photo as an example. If I had a 'group' tile that was made up of 3 custom tiles overlaid on each other, the 'group' tile would actually reflect the 3 individual bulbs.
In my home, I have 3 bulb ceiling fans. One in each room.
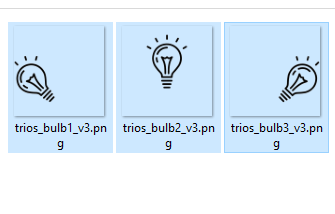
If each bulb of the group had an icon:
and I overlay the tiles I could effectively have a group icon that would have the ability to 'see' the individual state of each bulb, while still looking like a single tile.
Thats the theory anyway. I recognize the immediate problems - a, I loose the functionality of control of each bulb. Technically there is a 4th layer as I a completely transparent top layer of the group so the tile still functions.
My CSS is strong. I may not be ninja, but i'm pretty much a black belt! I know how to write the css easily, but getting it into your app is harder.
I mentioned early I had a question as well. Can you point specifically to your source for icons? I stumbled hard trying to find the origins of the icons so I could play... would you mind hard-coding the link in a response?
Maybe I'm misunderstanding (and apologies for inserting myself into the discussion), but isn't this ability already provided by turning on the 'Show contents' feature of a folder?
You would create a folder contaning the bulbs you're interested in. Long press on the folder, flip the 'Show Contents' switch, and then the folder tile displays the first four items within, including their icons (which reflect their currrent attribute state).
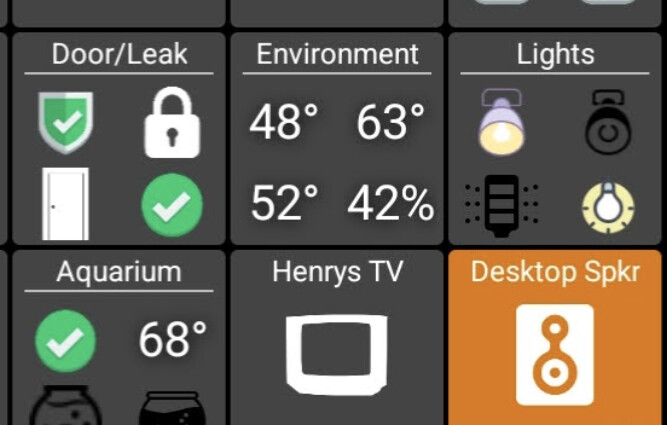
I use this feature a lot for a quick overview of the state of things I am most likely to check; here's an example showing some bulbs that are currently switched on in the 'Lights' folder tile:
OmG. thats genius - my tiny brain never considered folders as a solution! I will play in that sandbox a bit! @jpage4500 pls put my post out of your mind for a bit! (Except for that 'what is the source location of icon images...)
I do have a use case for changing by a large amount, but see caveat at end. When I leave and return from my home I change the temperature down or up by more than 10 degrees. I discovered early on with the builtin dashboard that you could only press down or up maybe three or four times before it lost sync with the hub. I think the same thing happens with this dashboard.
I eventually found what is probably a better solution anyway. I have virtual switches for temp down and temp up that then call a rule that makes the step change in temperature. I say this is a better solution because only at these times is when I want the big step size, the rest of the time when I am present I'm only adjusting by a degree or two and the Hub can keep up.
I also use virtual switches to make big changes in setpoint when I am away from home and a peak power outage is scheduled. Then I turn heat up for a while in advance to prevent my backup heat from using too much fuel (place starts out warmer before the temporary power shutoff so it takes longer before I need backup heating).
Yes, I thought of that method also... using a virtual switch to "bump" the setpoints indirectly, and have tiles on the dashboard for the switches rather than the T6 controller (or in addition to), for setpoint control.
I just wanted to know IF there was a way to specify the increments.
This dashboard is just getting better and better though!
Still a lloooong way to go (for me) to find all the neat things it can do, but I will get there!
Thank you for your suggestion and thoughts!
I have some DS18B20 probes that I use to monitor the temps in some freezers. Is there a way to set a temperature warning? So, let's say if I want the freezer to be at a certain temp range the temp tile would read normal and in a certain color and if outside the set temp range, the tile would change color to alert me that there is a problem. I also have a power loss monitor that could work the same way.
I already have notifications set up to send a text through Hubitat. I was thinking that if the tile itself changed colors, say from blue normal and to red if there is a problem, then other family members would see there is a problem by looking at the dashboard screen. Sometimes I am out of town and may not get the text alert.
A workaround may be to add some virtual switches, one for each device you need warnings for, which a rule will turn on when the watched device is outside certain parameters. Set up a folder called "Warnings" in the app, and put all these switches inside that, having the folder set up to show count of things On. Then anyone can see at a glance if one of the warnings is on and go into the folder to see what it is.
A kind of new issue I can't solve -
Recently began using the trick of using a Folder, dropping the devices in and showing their state on the top level folder. works perfect for my needs.
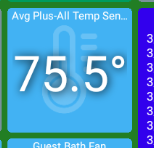
I have an Average Temperature which is derived from all the temp sensors throughout.
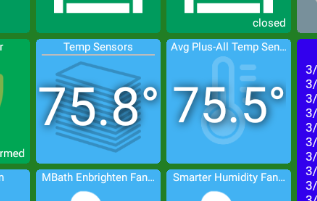
I created a folder, dropped the Avg Temp icon into it - and viola. my average temp on the top of the folder! great... then I add all my temp sensors into the folder. Now I get multiple values displayed on the top folder. So I created a folder INSIDE my folder and moved my devices into it - all except the Average device (which is virtual).
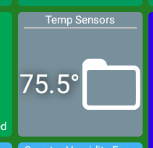
THe result is:
I can't seem to find a way to use the Average Temp device as the icon for a folder. Can anyone think of a way? Ideally I'd like it to look like this:
with the aforementioned group of temp sensors inside the folder for drill down ability.
I think what I'm asking is a feature request: the ability to choose a device as a folder icon.
** Edit/Update ** I can almost make this work - if we have the ability to choose the icon for a stacked folder I can get the function to work by using 'stacked' with the Averages virtual device as the first icon...
Thanks! That issue does seem to be gone, the weird thing now is that if you open your recent/running apps, it shows a screen of each and every widget you've opened. Not a huge deal, just thought I would make you aware of it just in case.
One question though, is there a way to modify the default icon that the button widget uses? Updating lights and such seems to automatically update that widget, but can't seem to change the button icon itself, just the actual buttons within.