Yes. Remove your old devices.
Make sure you have downloaded and saved both drivers from the GitHub repository. Save them under driver code menu.
Start fresh by removing the app and reinstall it and follow the steps one by one.
You should get a parent device for each emporia device and a child device for each circuit.
Good luck.
i know this is a old thread.
just installed this with a vue 3.
its only showing one device:
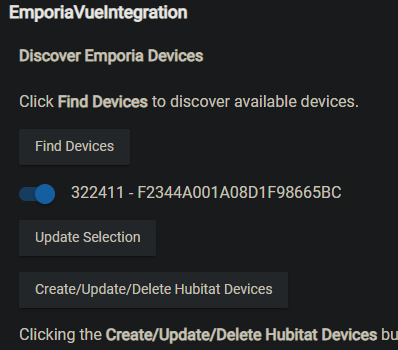
how do i see all the circuits?
Hi @benji.aaron ,
The discovery process is showing you the main Emporia devices only. Click Update Selection and then click "Create/Update/Delete Hubitat devices" and the child devices (circuits) will be automatically created by the app.
You should see them as child devices in the device page:
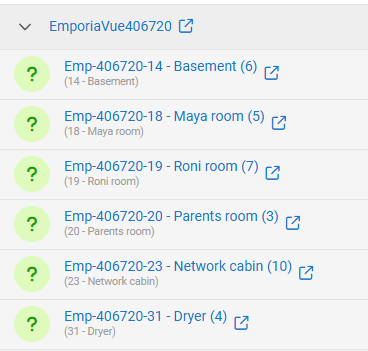
Thanks! It ended up being the child device app/driver didnt install. Deleted, reinstalled, and they where all discovered!
FWIW it works great on Vue 3!
Thanks for this. The readme instructions were clear and install was straight forward for my V2. Now it's time to learn Graphana.
What is the suggested effective refresh interval that does not get sideways with Emporia?
I guess it depends on what you are looking for and how many of the circuits you will send to grafana. I am using a 1 minute interval from emporia cloud to Hubitat and then a 15 minutes interval when sending data to influxDB. I am currently sending about 25 circuits.
Hubitat seems to be happy with this for now.
I just lately started thinking I do not really NEED all these circuits in grafana so I might changes these settings.
I was actually wondering about the limits on the polling rate from Emporia. How long have you been running one minute intervals with 25 devices? Are we only getting the instant info with each retrieval or is it a cumulative average between polls?
I have installed your code and it works perfectly! I am wondering if there is a way to use an even shorter retrieval frequency, maybe 5-15 seconds. 1 minute is too short for my purpose.
Hi.
This is doable technically. But, please understand this is not recommended.
Emporia API is cloud-based, not local. Polling every 5–15 seconds will likely hit rate limits / throttling and make the integration less reliable.
Hubitat will also take a hit (more HTTP calls, more events, more DB churn.
I will add the option in the code so you can try it at your own risk.
I’ll try to it tonight and post when updated.
I see. Maybe I will test it at different intervals if it can be done...like 15 and 30 seconds.
thanks for your help.
Hi @richberman ,
As per your request I have added the 15 and 30 seconds options.
Please note i did not test it myself so let me know how did it go.
Updated code is located in a DevBranch folder in my github repository at:
Thank you so much. I have tested it with 15 and 30 seconds and as you suggested the status takes almost a minute to update. I assume it's because of the back and forth to the cloud. Is there a way I can "ping" the current status directly from Emporia side instead to receive and instantaneous "current" which would be faster?
Not that I am aware of.
What is your use case?
I use switches to turn ev chargers on and off after payment is received. I am trying to confirm the chargers are either on or off via the current in the circuits since sometimes the responses from the switches themselves are inconsistent.
I see. In this case a could based solution like Emporia is problematic. There was a post in the comunity by a user suggesting some modifications to the Emporia device to allow it integrate locally, you might want to search for it.
Another option would be to use Aeotec’s AeonLabs Z-Wave energy reader for that purpose.
It can be flashed with ESPHome evidently then run locally if you have the skills.
I am seeing some strange duplication of the response data when the retrieval frequency is set to 1 minute. Very often the usage data for all the circuits is exactly the same as it was in the previous minute. In the worst case this happens 50% of the time (every other minute). Is anyone else seeing this?
This is expected behavior with Emporia when using scale = 1MIN.
At 1-minute resolution, Emporia does not return instantaneous readings. It returns minute buckets:
- usage / energy = total kWh accumulated over that minute
- power = average power over the same minute, derived from the energy bucket
(power ≈ usage × 60,000)
Because of this:
- If your poll lands twice on the same backend minute bucket, Emporia will return identical data.
- If loads are stable, consecutive minute buckets can legitimately be identical (especially after rounding).
- Polling exactly every 60s often causes the “every other minute identical” effect due to backend timing vs client timing.
You can verified this mathematically:
usage × 60000 ≈ reported power (exact match within rounding), which confirms minute-averaged data, not live samples.
Takeaway:
This is an Emporia API characteristic, not a client/driver bug.
If you need more variability, poll less frequently or treat 1MIN data as averaged, not real-time.
EmporiaVue Integration for Hubitat – Version 1.1.2 Released
I’ve published version 1.1.2 of the EmporiaVue Integration for Hubitat.
This release focuses on improving reliability, observability, and recovery behavior, particularly around authentication failures and data retrieval issues.
Key Improvements
Improved handling of HTTP 401 responses
- Fixes a case where
401errors returned through the exception path were not handled correctly. - The app now properly triggers token refresh and retries the failed fetch.
Fetch health monitoring
- The app now tracks the operational health of data retrieval.
- It records consecutive failures and the time since the last successful fetch.
Configurable health notifications
Users can now optionally receive alerts when the integration stops working as expected.
Notification options include:
-
Selecting one or more Hubitat notification devices
-
Custom failure message text
-
Custom recovery message text
-
Configurable alert thresholds:
- after X failed fetch attempts
- after X minutes without a successful fetch
- or either condition
Single alert per outage
- To avoid notification spam, the app sends only one alert per outage event.
Recovery notification
- When the integration resumes normal operation, an optional recovery notification can be sent.
Manual authentication alerts
- If token refresh ultimately fails and manual authentication is required, the user is notified immediately.
General cleanup
- Code cleanup and consolidation of helper methods.
What this means in practice
The integration is now significantly more resilient:
- Temporary network outages recover automatically.
- Token expiration issues recover automatically when possible.
- If recovery fails, users receive a clear notification instead of silently losing updates.
- Notifications are designed to avoid alert fatigue.
Update Instructions
- Replace the existing EmporiaVueIntegration app code with the latest version from GitHub.
- Save the app code.
- Open the app in Hubitat and click Done to ensure scheduling is refreshed.
No device re-creation is required.
GitHub
Repository:
https://github.com/amithalp/EmporiaV2
Release v1.1.2 is now available.
If you are using this integration with InfluxDB / Grafana dashboards or other monitoring tools, this release should make the integration noticeably more robust.
As always, feedback and bug reports are welcome.