BirdWeather PUC — Hubitat Driver
If you have a BirdWeather PUC station, this driver integrates it with Hubitat Elevation — exposing live bird detections as device attributes and events so you can use them in automations and dashboards.
You don't even need your own station — the driver works with any public BirdWeather station. Browse the map at app.birdweather.com to find one near you.
What it does
The driver polls the BirdWeather API on a configurable schedule and keeps a set of attributes current:
- Latest detection — common name, scientific name, confidence %, certainty level, time, species photo URL, and audio clip URL
- Today's summary — unique species count, total detection count, top species and its detection count, and a full JSON list of every species seen today
- Lifetime totals — cumulative all-time counts pulled directly from the BirdWeather API: unique species (
lifetimeSpecies), total detections (lifetimeDetections), and a full sorted species list (lifetimeSpeciesList). These reflect your station's complete history and are always accurate regardless of hub downtime. - Trigger events —
birdDetectedfires on every new detection;newSpeciesDetectedfires the first time a species is seen each day (resets at midnight)
Automation ideas
Announce every detection on a speaker:
Rule Machine → Trigger:
birdDetectedchanges → Speak "%lastSpecies% detected in the backyard"
Push notification for a new species:
Rule Machine → Trigger:
newSpeciesDetectedchanges → Send push "%value% (%lastSpeciesScientific%)"
Flash a light on a high-confidence sighting:
Rule Machine → Trigger:
birdDetectedchanges → Condition:lastCertainty=Almost Certain→ Flash light 3×
Dashboard tile:
Add lastSpecies, todaySpecies, and todayDetections as Attribute tiles. Or use Tile Builder Grid for a richer display with the species photo, detection time, and today's stats in a single tile.
Installation
Via Hubitat Package Manager (recommended):
Search HPM for "BirdWeather PUC" and install.
Manual:
- Hubitat → Drivers Code → New Driver → paste
birdweather-puc.groovy→ Save - Devices → Add Device → Virtual → select BirdWeather PUC
- Open the device, enter your Station ID in Preferences → Save
- Click Refresh once — scheduled polling starts automatically
Finding your Station ID
The Station ID is the number in the URL when viewing your station at app.birdweather.com — e.g. app.birdweather.com/stations/12345 → ID is 12345. You can also find it in the BirdWeather app under your station's settings.
You don't need to use your own station — any public BirdWeather station works. Follow a local nature center, a favorite birding spot, or just the most active station in your area.
API Token
Only needed for private stations. Leave blank for public stations. The token is found under Advanced Settings in the BirdWeather app.
Preferences
| Setting | Description |
|---|---|
| Station ID | Numeric ID from your station URL |
| API Token | Optional — private stations only |
| Poll Interval | 1, 2, 5, 10, 15, or 30 minutes |
| Recent Detections to Track | Depth of the recentDetections JSON history (3, 5, 10, or 20) |
| Minimum Confidence % | Ignore detections below this threshold |
| Fire events only for certainty level ≥ | Filter events by certainty: all / very_likely / almost_certain |
| Pause polling at night | Skip polls between sunset and sunrise |
| Enable Debug Logging | Verbose logging in the hub log viewer |
Commands
| Command | Description |
|---|---|
refresh |
Poll the BirdWeather API immediately |
resetHistory |
Clear all state and attributes and re-poll |
Tile Builder Grid dashboard tile
If you have Tile Builder by @garyjmilne, the Grid layout makes a great single tile: species photo on the left, last detection details in the middle, and today's summary on the right:
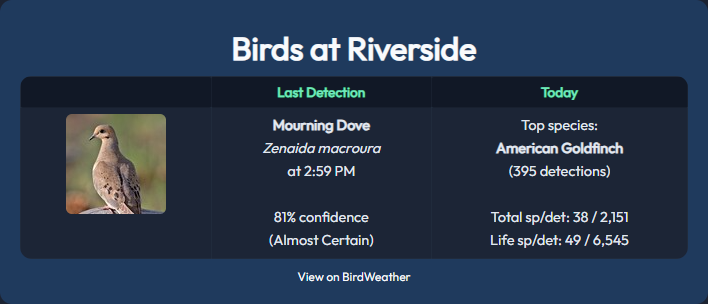
Note: The Grid layout requires a Tile Builder license ($12 minimum donation, unlocked inside the Tile Builder app).
Here's the setup I'm using. It's a dark-themed tile with the Outfit font, rounded corners, and a footer link to the station page.
Variables
Set up these variables in your tile's Variables section, all pointing to your BirdWeather PUC device:
| Variable | Attribute | Notes |
|---|---|---|
%pic% |
lastSpeciesImageUrl |
type: Image URL |
%bird% |
lastSpecies |
|
%sci% |
lastSpeciesScientific |
|
%when% |
lastDetectedTime |
|
%conf% |
lastConfidence |
|
%cert% |
lastCertainty |
|
%top% |
topSpeciesToday |
|
%topN% |
topSpeciesCount |
Cleanup: Commas |
%todaySp% |
todaySpecies |
Cleanup: Commas |
%todayDet% |
todayDetections |
Cleanup: Commas |
%lifeSp% |
lifetimeSpecies |
Cleanup: Commas |
%lifeDet% |
lifetimeDetections |
Cleanup: Commas |
Column content
- Column 1:
%pic%(set type to Image URL) - Column 2:
[b]%bird%[/b][br][i]%sci%[/i][br]at %when%[br][br]%conf%% confidence[br](%cert%) - Column 3:
Top species:[br][b]%top%[/b][br](%topN% detections)[br][br]Total sp/det: %todaySp% / %todayDet%[br]Life sp/det: %lifeSp% / %lifeDet%
Basic Settings
Before importing, change at minimum:
#tt#:My Bird Station→ your tile title- The station ID inside
#ft#(the footer link) → your station ID
Note on tile ID: The override CSS uses
#id#, update the CSS class names in the Overrides to match.
Note: The
Import Stylebutton may silently fail — if nothing changes after importing, enter the key settings manually (colors, font size, borders, etc.).
[#R0C1#: , #R0C2#:Last Detection, #R0C3#:Today, #R0C4#:Other 2, #R0C5#:Other 3, #bc#:#334155, #bfs#:18, #bm#:Collapse, #bo#:0.2, #bp#:6, #br#:2, #bs#:Solid, #bw#:1, #comment#:?, #fa#:Center, #fbc#:#1e3a5f, #fc#:#6ee7b7, #fs#:75, #ft#:[a href='https://app.birdweather.com/stations/12345' target='_blank']View on BirdWeather[/a], #hbc#:#111827, #hbo#:1, #hc1#:#008000, #hc10#:#F00, #hc2#:#CA6F1E, #hc3#:#0F0, #hc4#:#00F, #hc5#:#F00, #hc6#:#008000, #hc7#:#CA6F1E, #hc8#:#0F0, #hc9#:#00F, #hp#:0, #hta#:Center, #htc#:#6ee7b7, #hto#:1, #hts#:85, #hts1#:100, #hts10#:100, #hts2#:100, #hts3#:100, #hts4#:100, #hts5#:100, #hts6#:100, #hts7#:100, #hts8#:100, #hts9#:100, #iFrameColor#:#1c2333, #id#:qq, #isAlternateRows#:true, #isBorder#:true, #isComment#:false, #isFooter#:true, #isFrame#:true, #isHeaders#:true, #isOverrides#:true, #isTitle#:true, #k1#:?, #k2#:?, #k3#:?, #k4#:?, #k5#:?, #ktr1#:?, #ktr2#:?, #ktr3#:?, #ktr4#:?, #ktr5#:?, #myKeywordCount#:0, #myThresholdCount#:0, #rabc#:#253044, #ratc#:#e2e8f0, #rbc#:#1e293b, #rbo#:0, #rp#:0, #rta#:Center, #rtc#:#e2e8f0, #rto#:1, #rts#:90, #ta#:Center, #tbc#:#1c2333, #tbo#:0.9, #tc#:#f8fafc, #tcv1#:70, #tcv2#:70, #tcv3#:70, #tcv4#:70, #tcv5#:70, #tff#:Arial, #th#:Auto, #to#:1, #top1#:0, #top2#:0, #top3#:0, #top4#:0, #top5#:0, #tp#:8, #ts#:200, #tt#:My Bird Station, #ttr1#:?, #ttr2#:?, #ttr3#:?, #ttr4#:?, #ttr5#:?, #tw#:100]
Overrides
#head#=[link rel=stylesheet href='https://fonts.googleapis.com/css?family=Outfit'][style].qq{border-radius:12px!important;overflow:hidden!important} .qq img{max-width:100px;height:auto;border-radius:6px!important;display:block;margin:0 auto} .qq td{padding:10px;line-height:1.6;vertical-align:top!important} ftqq{font-family:'Outfit';margin-top:10px} ftqq a{color:#f8fafc;text-decoration:none} ftqq a:hover{text-decoration:underline}[/style]
 | #tff#='Outfit'
 | #Title#=font-weight:900
Known limitations
None currently. (The BirdWeather API stats endpoint previously had a bug where period=all returned incorrect counts. This was reported and fixed by the BirdWeather team, and the driver was updated in v1.3.0 to use API-sourced lifetime totals.)
Links
- GitHub: hubitat-drivers/birdweather at main · brossow/hubitat-drivers · GitHub
- HPM: search "BirdWeather PUC"
Feedback and bug reports welcome — either here or as a GitHub issue.