Using Grafana v10.0.3 (eb8dd72637).
Yes, the color scales seems to be messed up for me as I am using MB and degrees C.
I've corrected hub info memory details (had to remove the extra zeros under thresholds).

1 Like
Ok that is the same as me, what Influx version then, maybe my query is using something new.
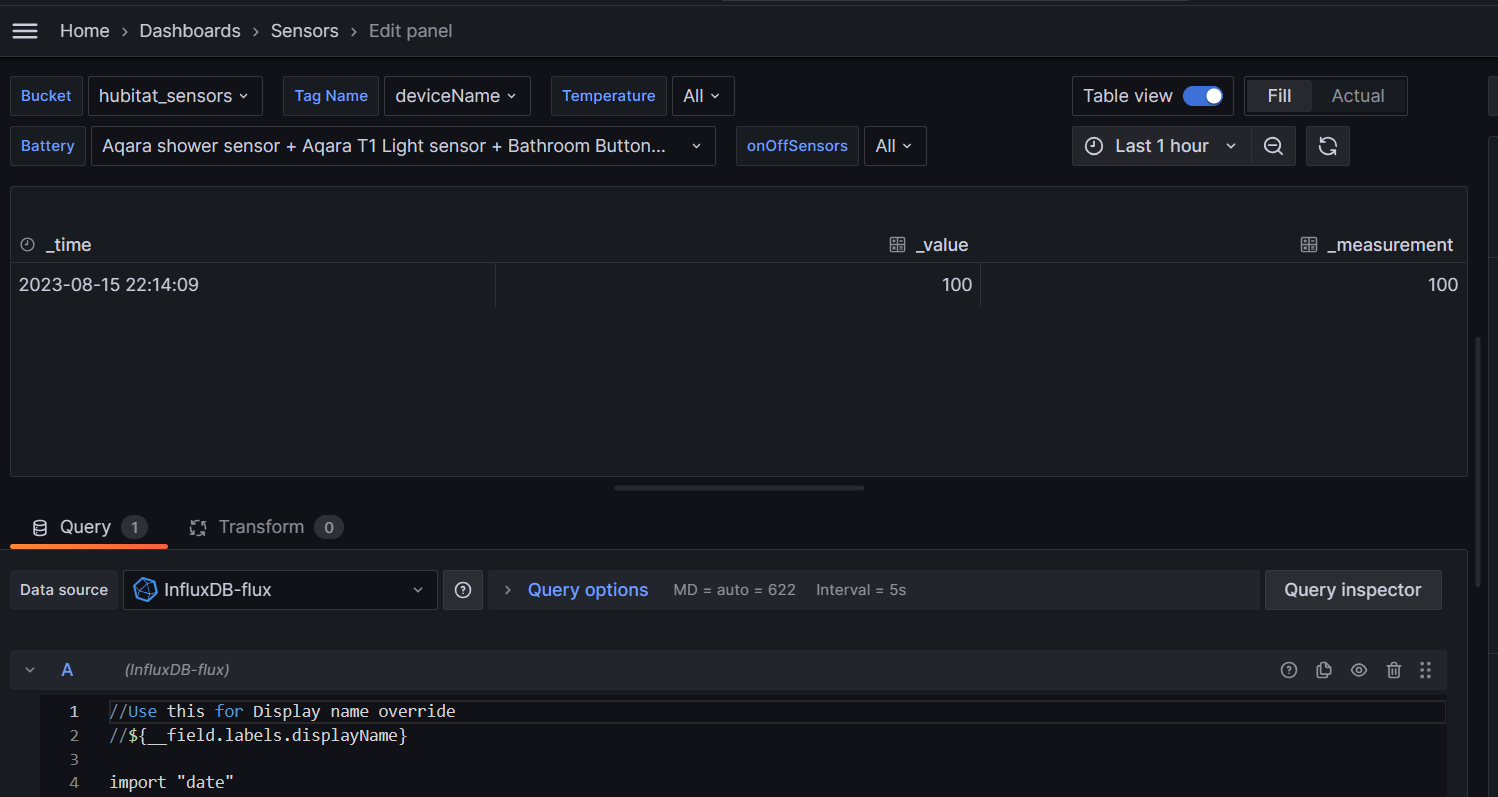
Your data table looks nothing like mine, which is why the chart is screwed up.
Try commenting out this second part by adding a // in front.
  //This adjusts the _measurement to be the value so it sorts by value
  |> map(fn: (r) => ({r with _measurement:r._value}))
Using InfluxDB v2.7.0 | Server:85f725f | Frontend: 0c844dc
This section below seems to be commented out already:
EDIT: added // in the second line as well, no change.
1 Like
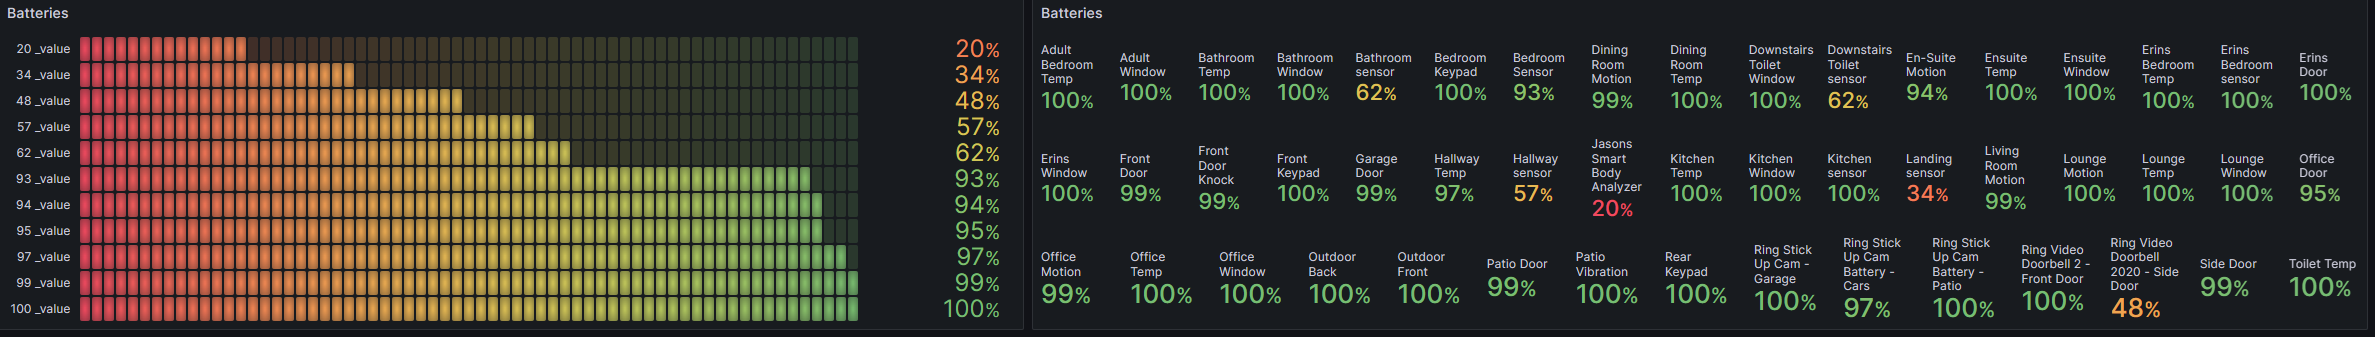
I forgot to change one of my hardcoded values to the variable, for the led panel here is the new line (also un-comment that other line if you want it sorted by battery %)
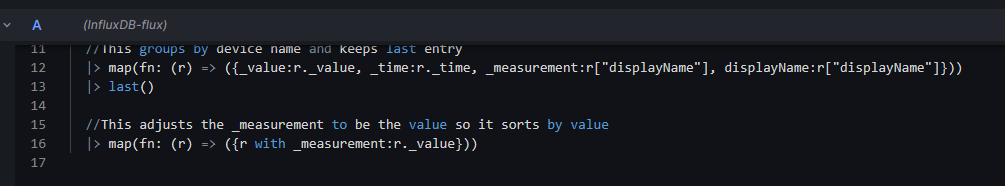
  //This groups by device name and keeps last entry
  |> map(fn: (r) => ({_value:r._value, _time:r._time, _measurement:r["$tagName"], displayName:r["$tagName"]}))
  |> last()
And this for the stats panel to the right
  //This groups by device name
  |> map(fn: (r) => ({_value:r._value, _time:r._time, _measurement:r["${tagName}"]}))
I will export a new file shortly as well, but since you made other fixes I figured you would want to just edit the code yourself.
1 Like
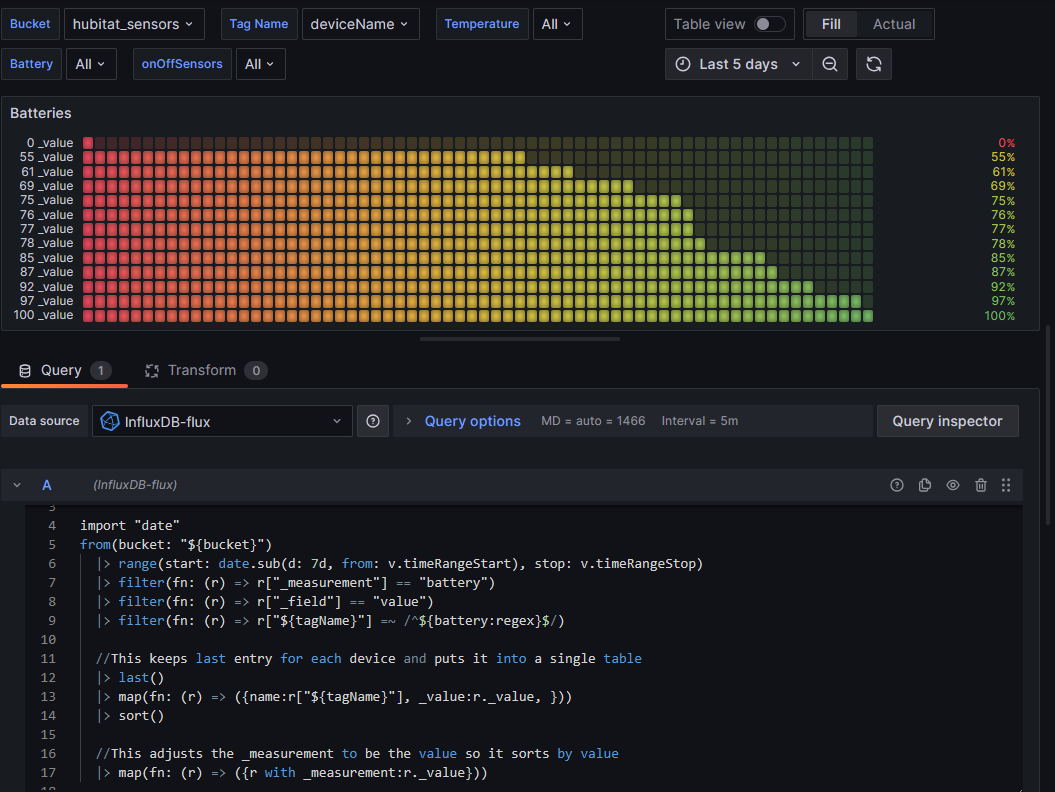
It seems to be related to the "Max Data Point" size under Query Options. Which seems to change based on some criteria. If i set it to 9k i don't seem to have any issue displaying anything. For some reason initially it was showing 740 but now it is over 1300 after i messed with it. I think part of the issue is I collect free memory every min instead of 5 so well x5 the data points
1 Like
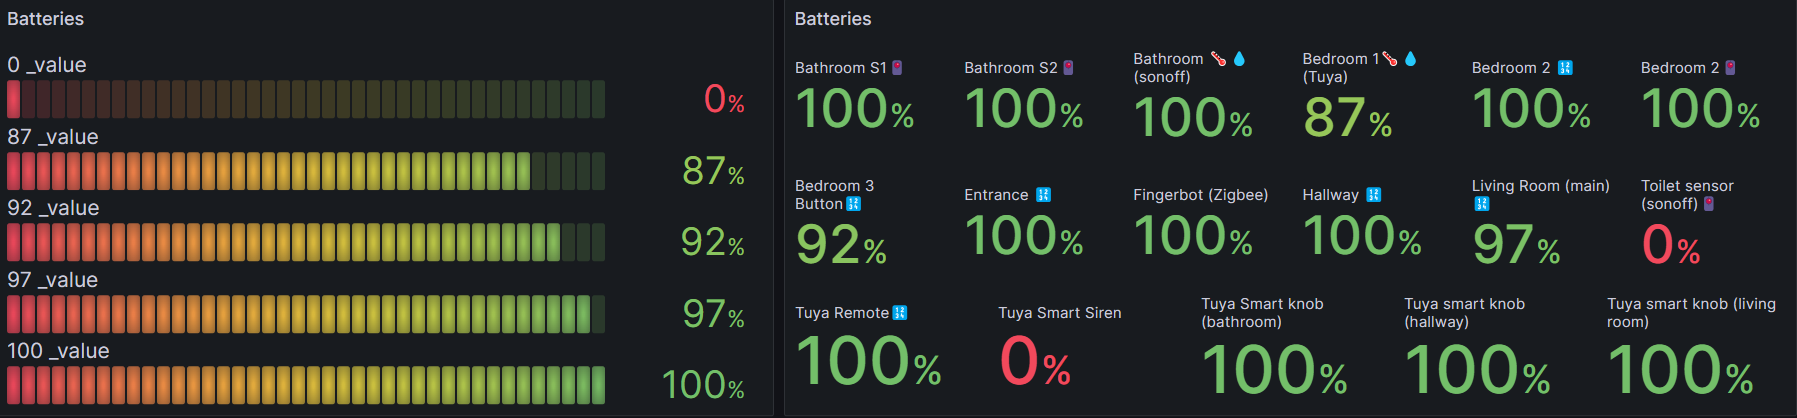
Thanks for the update - chart on the right side is working great, but there is still some issues for the chart on the left (right hand chart is sufficient for me!).
1 Like
I have those left to "auto" but I think I am supposed to use those values in my query with an aggregateWindow function. I had taken that out since it never seemed to do anything. I will look into it and possibly give you a new query to try out.
I think I have this figured out now but it is sort of a hack, I am going to mess around with it some more and see if there is a better way. Then check over all queries on the sensors dashboard again and post a new version when ready.
Thanks for testing and giving feedback!
1 Like
@mavrrick58 Try adding this at the end of the query for the chart you had issues with the history. Also blank out the "Max data points" setting to make it go back to default. This should allow more data to show and also smooth out the chart a little when looking at a large range with many points.
|> aggregateWindow(every: v.windowPeriod, fn: mean, createEmpty: false)
That did it. Now i can expand that time out as far as i like and it still works.. Thanks..
1 Like
Awesome, thanks for confirming. I will go through and add those to all my dashboards and post new versions when I get a chance. I have to decide on each one if I want to aggregate on a mean, last value, or max for that chart. Mean will probably be used most often.
1 Like
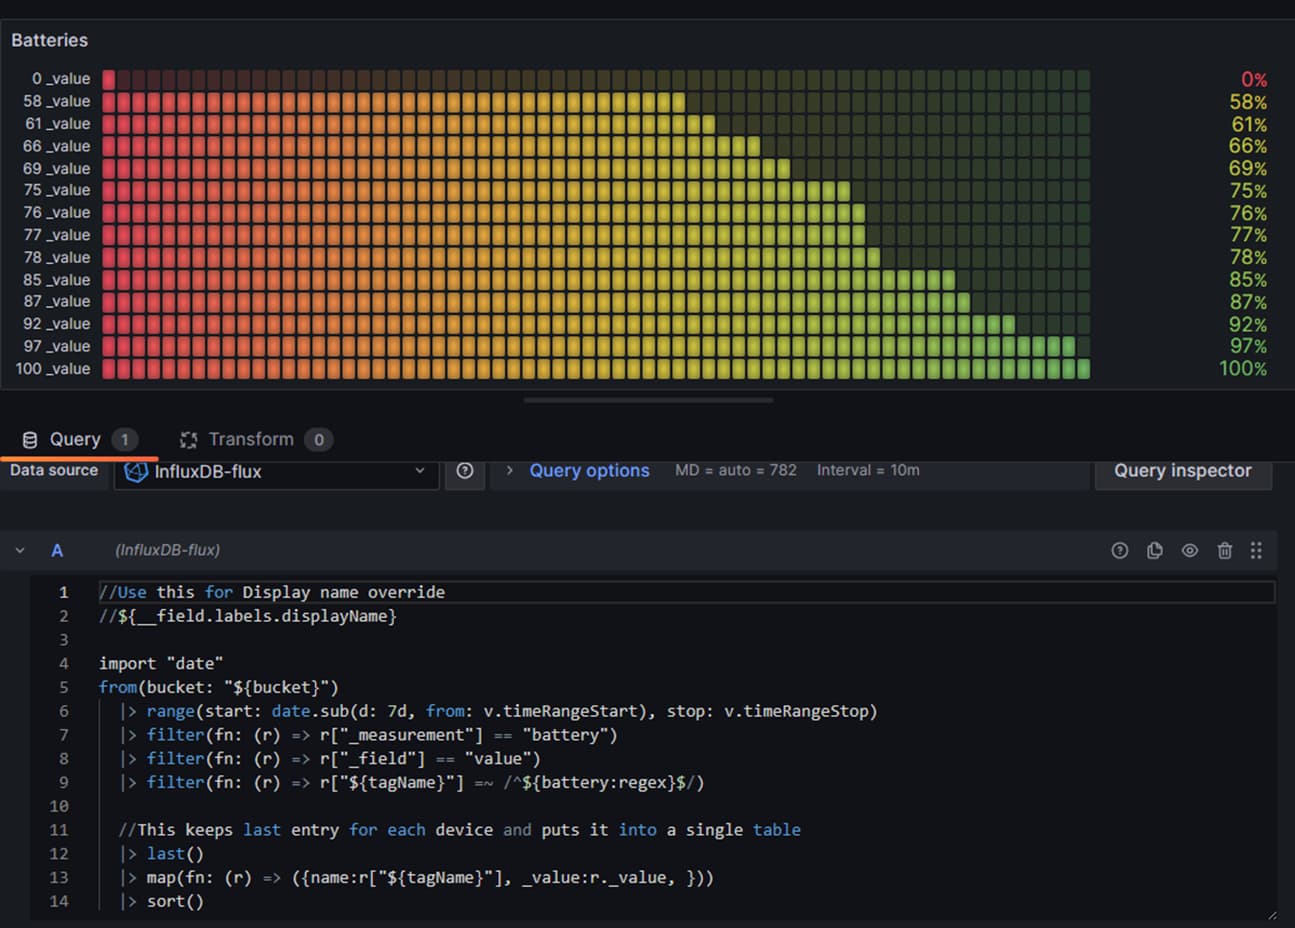
@iEnam can you edit the code on that battery LED guage and change it to this to confirm if it works for you? I found what I would call a "proper" way to handle this. I am getting this Flux thing figured out.
import "date"
from(bucket: "${bucket}")
  |> range(start: date.sub(d: 7d, from: v.timeRangeStart), stop: v.timeRangeStop)
  |> filter(fn: (r) => r["_measurement"] == "battery")
  |> filter(fn: (r) => r["_field"] == "value")
  |> filter(fn: (r) => r["${tagName}"] =~ /^${battery:regex}$/)

  //This keeps last entry for each device and puts it into a single table
  |> last()
  |> map(fn: (r) => ({name:r["${tagName}"], _value:r._value, }))
  |> sort()
You left the bottom part in there from the old query, the code I posted above is the ENTIRE query.
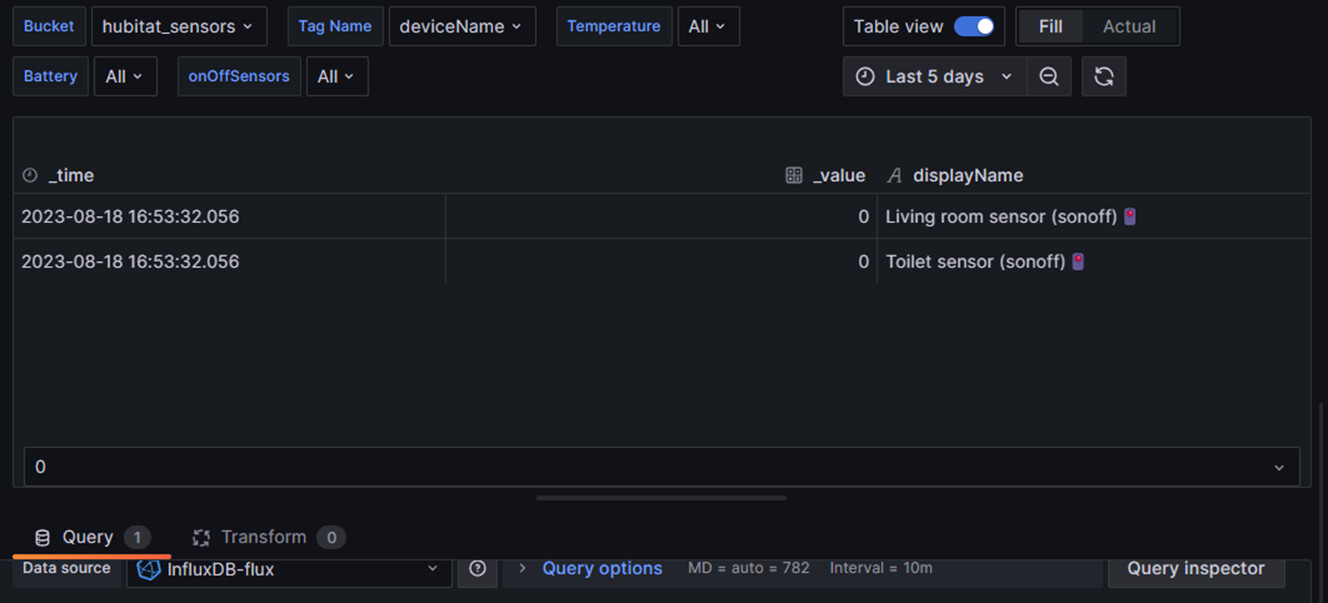
You still have something in there screwy, I can tell by the table output.
I am pretty sure it will work, I will finish the rest of my changes and export a new full JSON file hopefully today.
1 Like
These are excellent - thanks. Been trying for a few days to get the sensors one working, and an update of my Grafana docker container did the trick. I previously had my own Temp/Humidity dashboard set up which was working fine, and that put me off the trail of the issue for a while!
How do I go about fixing the battery labels on the left chart? I have fiddled about, but not had any luck.
Also (apologies - not that familiar with Grafana) where the 'field name' is ${__field.labels.displayName} - is there any way to change that to mask it? e.g. Some of my Sensors are called 'Adult Bedroom Temp' (done to make creating Automations Easier) - I'd really like the field in the Grafana Panel to drop the last 'Temp', so it just says 'Adult Bedroom'. I understand I can create an override for each and every 'where field name = ' call it this instead, but that will take a while and I was hoping you could do something dynamic that automatically masks new devices?
If you replace ALL the query code on that chart with from post above it should fix that battery led panel: Ready-to-Use Grafana Dashboards! - Beta Test / Feedback - #93 by jtp10181
I have not posted a new version with the fix yet.
For removing the "Temp" from the name, I have read about a transform option to regex rename things, but I have not used it. That could probably be used to strip certain keywords out of the names.
1 Like
Thanks @jtp10181 - that's not worked, sadly. Replacing the code on the LED panel makes it even less useful!
I'll investigate Transform - that's a good shout
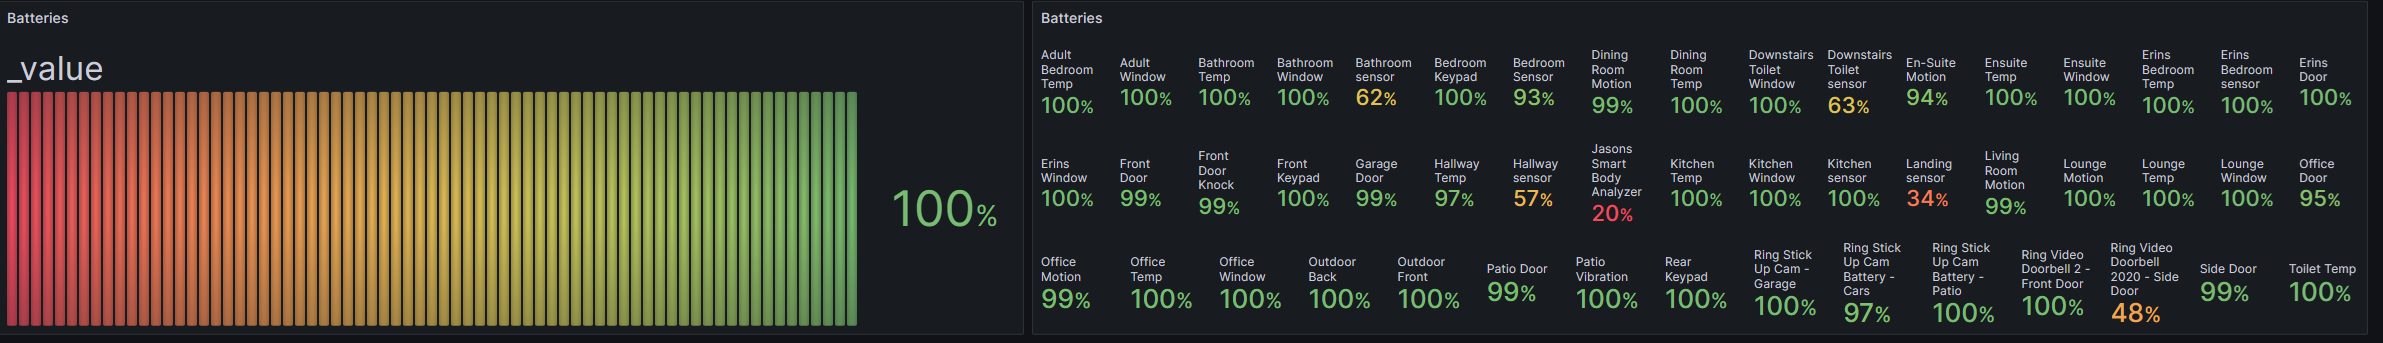
Oh duh I forgot I also had to change a setting on the dashboard:
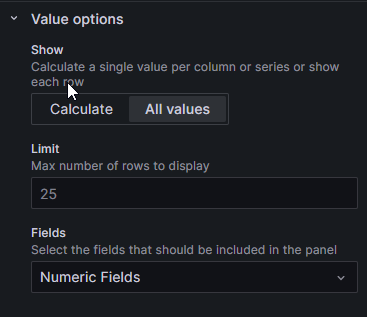
So there is a little more to it than just the query.
I just exported a new JSON file, so if you want to try importing that hopefully that will fix it.

