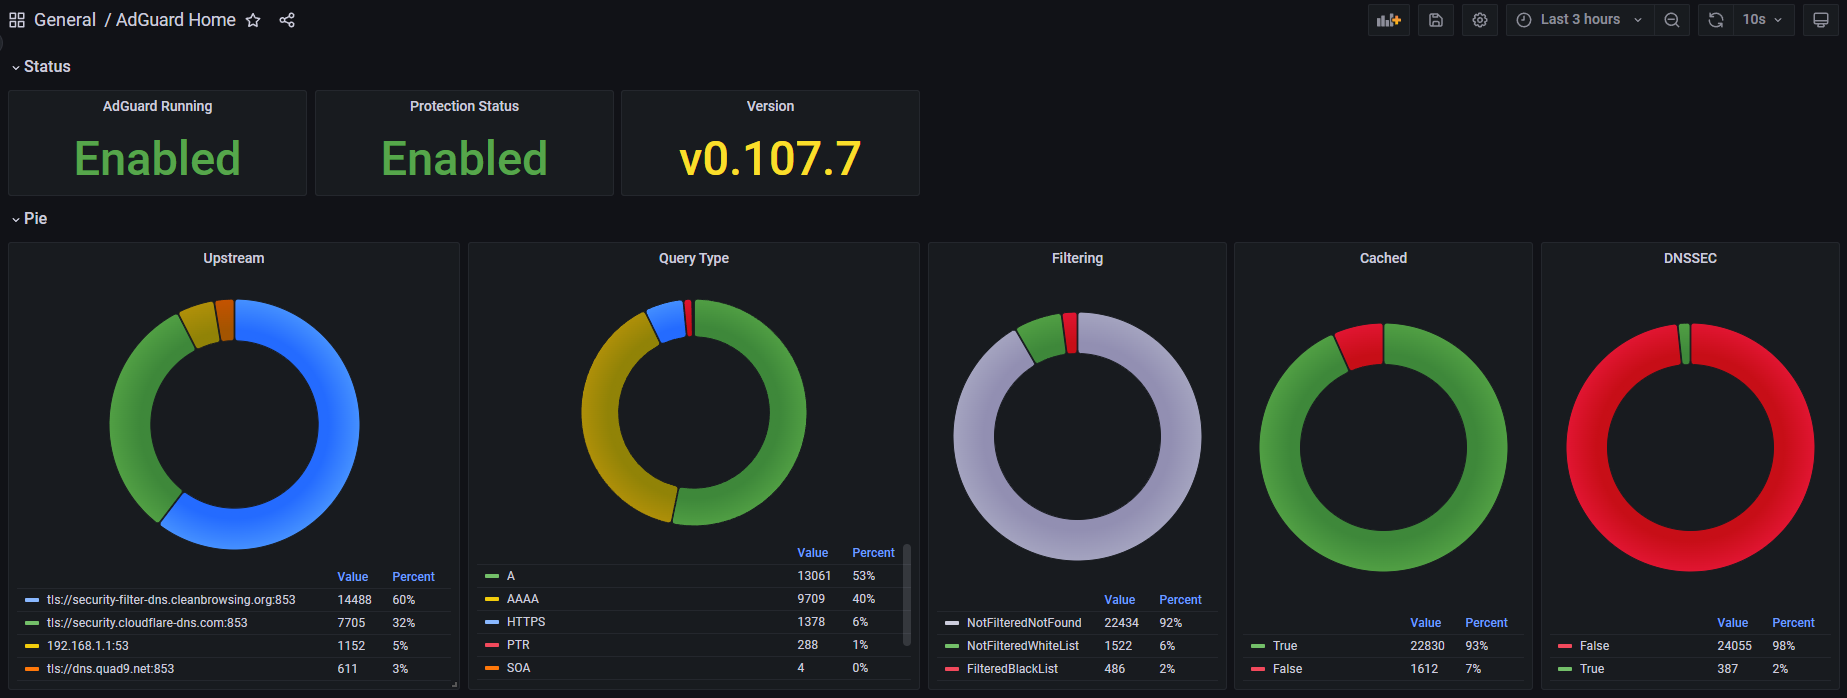
So I switched from Pi-hole over to AdGuard Home a while back but its lack of metrics on its dashboard were bothering me. I tried setting up a popular exporter and dashboard that I found online but it was missing the thing I wanted most, which was a breakdown of which DNS servers are being selected for upstream queries. Pi-hole has a chart for this right on the main page .
So... I wrote my own Telegraf input using the Adguard API and Telegraf json_v2 parser, send the metrics to Influx and started making a dashboard. I still need to add some line charts to see the trending over time.
I am not totally sure if I have the measurement/tag/fields setup quite right, I need to investigate that some more before I get too crazy because I might have to redo all the charts. Proof of concept is done.
l also want to make a Hubitat Driver to see and control the status of AdGuard similar to the existing pi-hole driver.
Would anyone else be interested in implementing this if I posted my configs and the dashboard on github?
I just switched to AdGuard Home about 3 weeks ago, from Pi-Hole for about 4 years.
Your charting looks useful but a Hubitiat driver would be much more interesting for me.
I'd like to gain the ability to block YouTube on specific clients using a ZWave button.
I have this set up with HA and Pi-Hole but since AdGuard is now my primary it's not useful unless AdGuard goes down.
AGH does have a sort of API that can be used. I actually started working on a driver just so I could turn it off from the dashboard and have it come back on automatically. Otherwise sometimes I turn it off and forget its off for a while until I start seeing ads all over. There is a Pi-hole driver I think on this forum someplace I was using as a starting point.
I don't do much blocking per client, I use the DHCP from the router.
I suspect with Pi-hole that HA was accessing it via command line on the same machine vs using an API? How did it setup the per client blocking? Maybe by adding a removing a group?
Anyway, for AGH, I see in the Persistent Clients section you can use their services blocking per client, is that how you want to block it or would you just do a custom filtering rule? I think both can be done from the API would just be a matter of building the correct command and putting it into a driver.
PH's lack of real API made it a little more challenging, but I have it set up to post to the groups endpoint (/admin/scripts/pi-hole/php/groups.php) to enable/disable an entry.
ie: {{group_endpoint}}?action=edit_domain&id=37&type=3&comment=YouTube+Regex&status=1&groups%5B%5D=1&groups%5B%5D=2&token={{token}}
For AGH it would just be to post to /clients/update. The real kicker with this one is that an update requires you to resend ALL of the config for that client and not just the updated keys. So you'd first need to query for the client config (/clients/find?ip0=10.8.0.11), make changes to the blocked_services, and then post the update.
Since I use UniFi for my DHCP I have static IPs set for devices I need to block. MAC blocking doesn't work for AGH unless you use it's DHCP server. The values of ids would be mac, ip, or hostname.
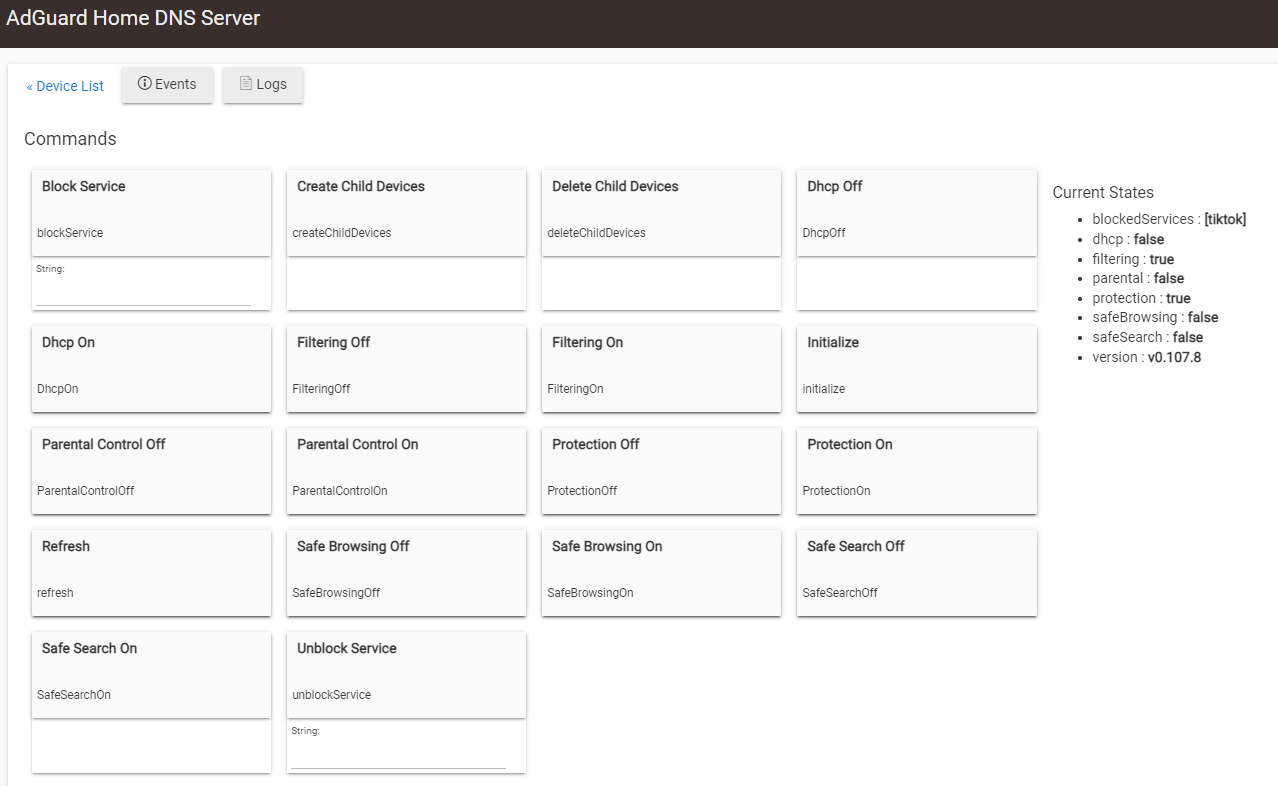
The app will currently create the DNS server for you but something is broken with the management after the fact.
Once the DNS server is created, you can toggle all the states and block/unblock services.
The Client driver is not in a usable state yet as I started with the server first.
Sounds good, I have not had a chance to check it out yet I was busy putting out some drivers for new devices. I did not forget about this I will be back to check it out as soon as I can!
This is what I'm looking for it. is the dashboard you remain using? if so, would you mind share with me the implementation guide on Github?
Thx a lot!!
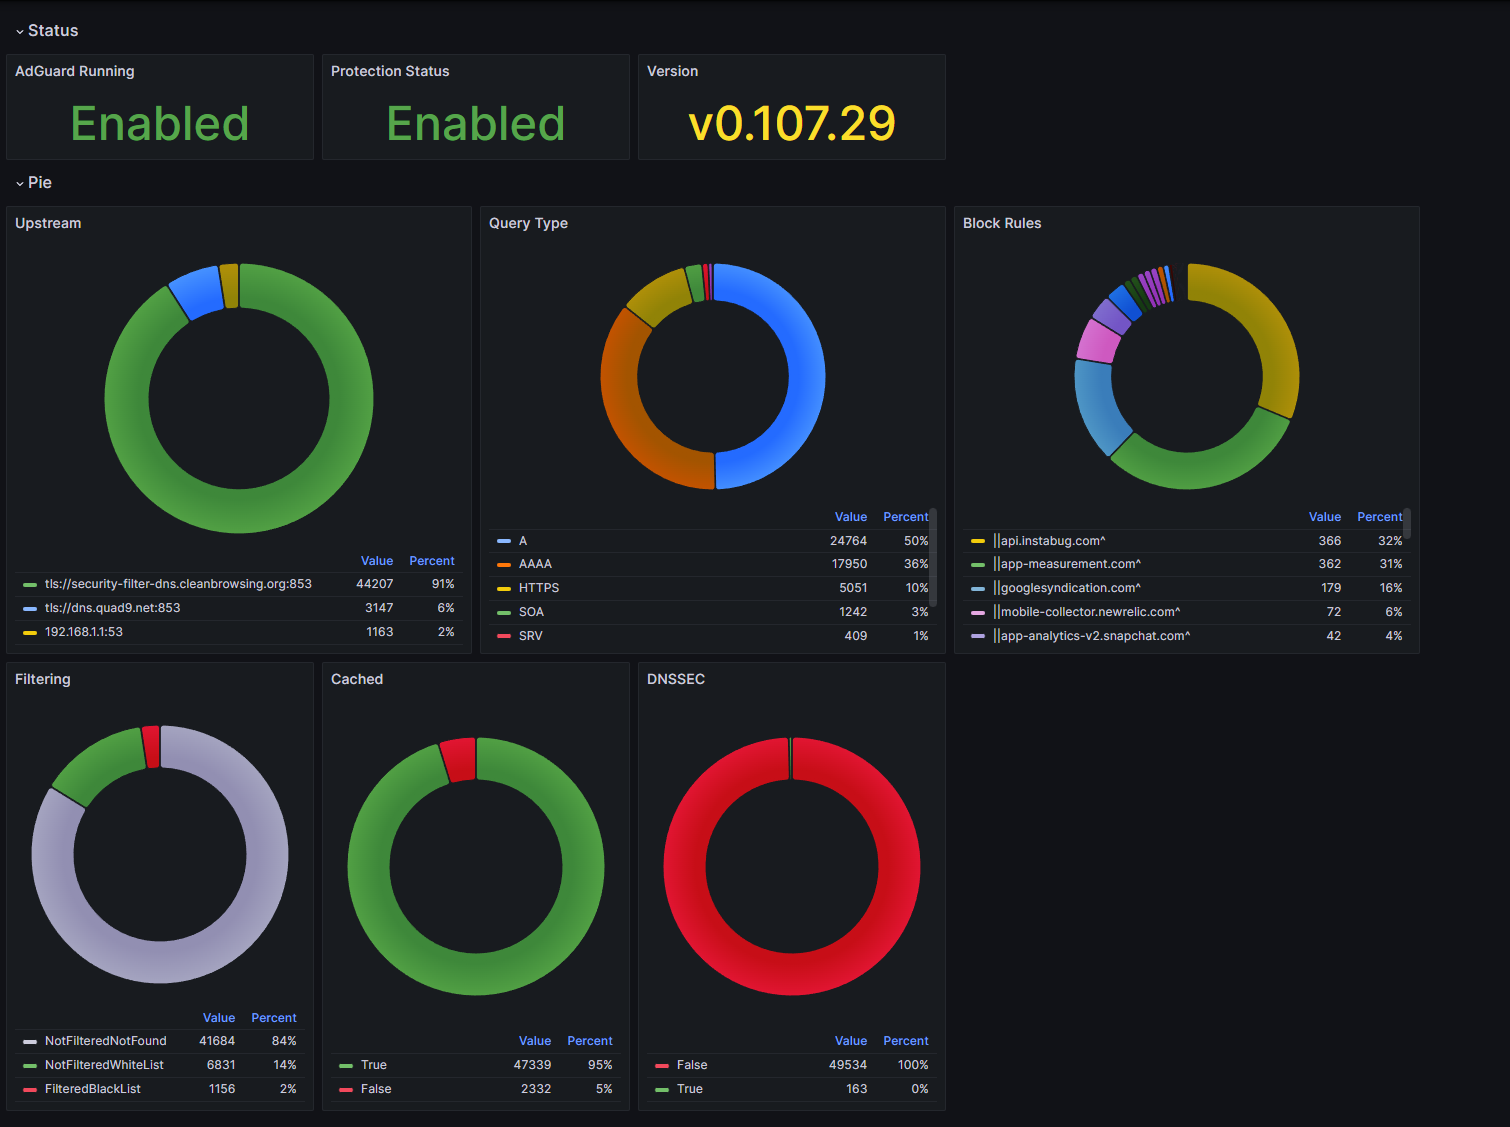
I have a legacy DRBP mapping on my Influx 2.x and it was easier for me to figure out the InfluxQL query so that's how I wrote it. I may try and upgrade it to Flux (for 2.x).
grafana dashboard: Adguard Home Dashboard · GitHub
Oh I like that way better, instead of using the API if its on the same server you just tail the log. That should be more efficient that what I was doing. I will have to look into that.
 .
.