Hi,
yes, i'm using Influx and Grafana addons from within HA.
Onely now, after you mentioned, I noticed that I would also need telegraf.
I'm not familied whit telegraf, and a quick look I do not find how to install it.
How do I install telegraf?
Hi,
yes, i'm using Influx and Grafana addons from within HA.
Onely now, after you mentioned, I noticed that I would also need telegraf.
I'm not familied whit telegraf, and a quick look I do not find how to install it.
How do I install telegraf?
This entire thing is more of an advanced setup, so may not be for everyone. Here are the telegraf docs: Install Telegraf | Telegraf Documentation
Another thing to consider is the current beta of AGH has added the one metric I really missed from PiHole which was how often each upstream was being used. I think it is slightly broken right now because it is reporting heavy on my router DNS but that is only used for local hostname lookups for me.
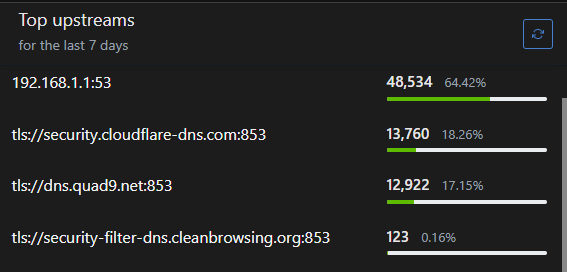
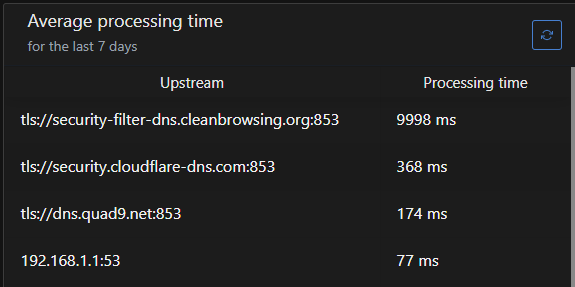
Also they show response time which is cool
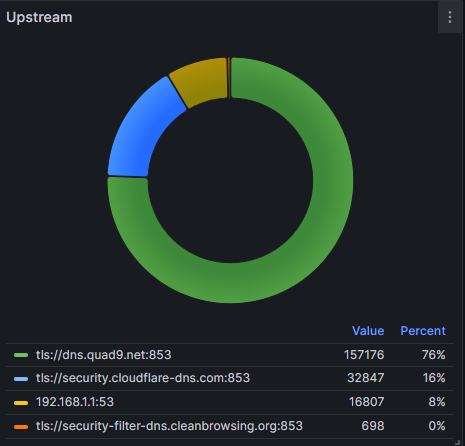
My dashboard (which I trust more) is not showing the same thing for the queries per service (also slightly different data range):
Download the Hubitat app

