OK, so the 2.3.0.121 or 2.3.0.124 versions (for sure, only ones I've really did the deep dive) have a perpetual memory loss and slow down. To @dJOS point, as soon as my hub gets below 300k as well, the slowdowns become humanly noticeable. From what I tracked previously, it's a linear slow/day effect. Once the memory drops way too far, I lose my Zigbee, the logs show that the Zigbee was disabled and re-enabled.
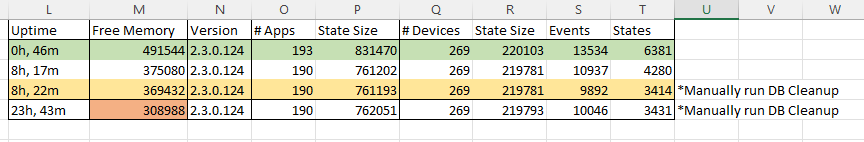
I had dropped all my events/states to see if that made a difference. It did reduce my DB size as expected, and the RAM swing from an hourly state/event cleanup to the next hour did reduce, but I'm still leaking RAM. Below is a screenshot of all my app states/events/state sizes. The green row was bootup. I was doing some cleanup, and deleted 3 apps (next row). I had lost 120k RAM, while having large reductions of states/events/state sizes (so this isn't related to them). Manually ran the DB cleanup, had further RAM loss, while removing more states/events.
Bottom row is a full 24 hours since reboot. I'm down to 308k of RAM, with zero correlation of that loss to my state sizes, states and events.
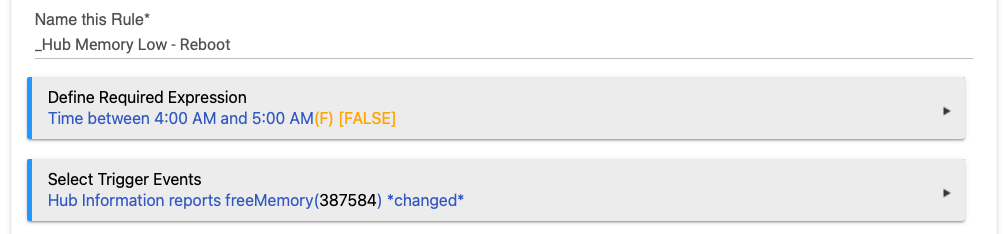
I am seeing similar slow downs and memory reduction over time as well. Just setup a reboot RM rule to fire if freemem drops below 300k as others have suggested. I hope the dev's are watching this thread and isolate the problem. It's fairly clear from my graphs and what others have shared that there is some sort of memory leak going on.
Edit: forgot to mention this is on my C7 hub. I haven’t look at this on my C5 yet.
The memory leak is present on the C5 as well. I can get away with rebooting at 200K. That gives me an average of 8 days between reboots. At the 300K threshold I would be rebooting daily.
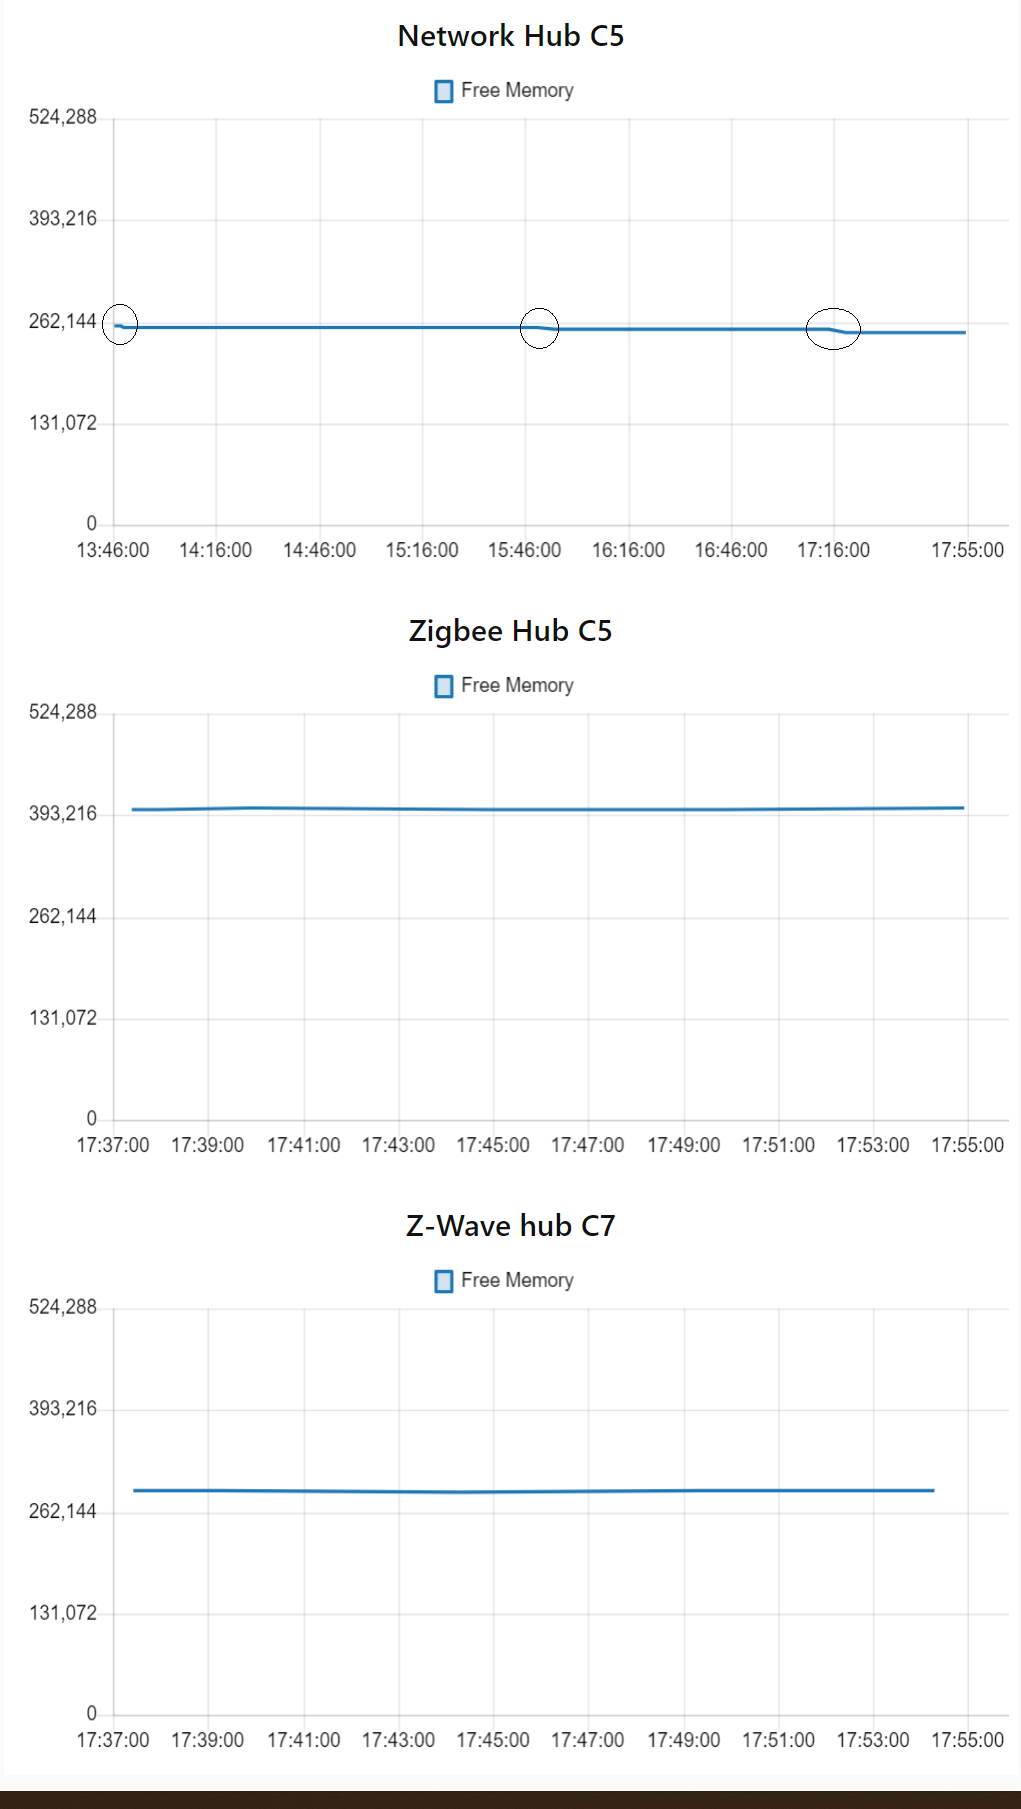
So thanks to @tsviper started some simple HubInfo monitoring of my 3 hubs - C7 Z-Wave, C5 - Zigbee, and C5 Cloud/Network apps. Nothing fancy just free memory data straight to a chart node, not retaining anything for now. On my cloud/network hub memory seems to be declining.
On that hub I have no rules and the following apps/devices:
Lutron
Alexa
Homebridge
Flume
Maker (4 instances)
Groups and Scenes (just removed)
HPM
HubInfo
Roku Connect (just removed)
Lift Off driver
My C5 & C7 seem to be okay but haven't been monitoring long enough to say for certain. These hubs are split out by function so will be interesting to see how that impacts things..
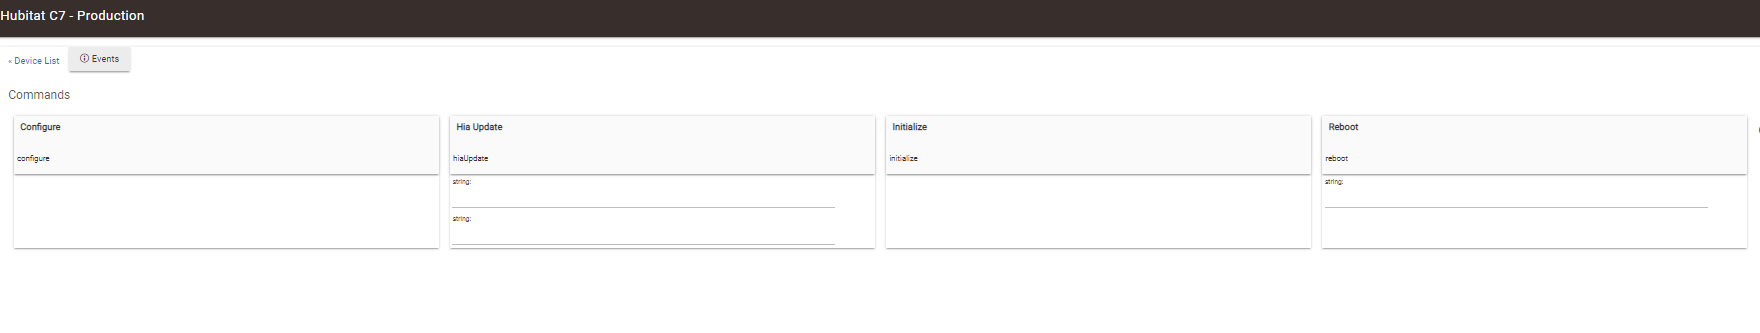
It doesn't exist - we use either the "Hub Information" driver reboot command (IIRC it's an Actuator) or the "Hubitat Hub Controller" driver (it's an Actuator).
Yesterday I thought it might be RM5. In dec the new update forced RM5. I disabled the 20 RM5 rules that I had ported to clean up ghost devices that got mirrored through RM4 rules during clones, and no difference in 4 hours. Hour by hour it still consumed memory.
I agree with your 300k comment. But wouldn't call this solved. With my current setup, I need to reboot in 1.5 days (300k point). Right now I've reverted to a daily 3AM reboot.