i new id read it somewhere , so less than 11 will trigger an instant clean up, and show higher cpu usage..
I don't recall exactly which version stopped that practice, but it's definitely not in 2.3.0.
Think the "instant" was removed in 2.2.8.x
So wherever its set at clean up will only happen hourly?
Hourly and right before the backup.
So state and event setting levels don't change anything anymore in regards to clean up/ trimming
They still are used to tune how much data gets left behind after the cleanup, same as before.
Double reboot is no longer necessary, BTW.
One thing that caught my attention in this thread (and I missed it earlier) is memory drop while doing rule changes. I'll check that out for 2.3.1.
Might look at anything that causes a re-compile. There are a couple of large apps that when I import and update their code I can guarantee there will be a memory drop.
Feel free to poke in my.hub, I've a ticket in on free memory drop
@gopher.ny FYI:
I added a "memory" check test to my hub so I could track the memory usage on my 2 C-7 hubs (on 2.3.0.124).
While the hub with my z-wave and zigbee devices seems to run for significantly longer periods without running low on storage, the hub that has my automations and apps seems to do fine for a bit over a week--then it starts "dipping" into the warning territory once in a while. As a few more days go by, the dips in free storage seem to get more frequent and deeper until it's time for a reboot.
There does seem to be a correlation with memory < 223000KB and things not working as well. So there does seem to be a slow memory leak. It's not bad enough to require daily restarts, but it seems useful to have my memory check running to trigger a reboot when it drops below a certain point without quickly recovering.
Device hub: restarted on 1/10/2022. It is now at 241944KB. I've not seen it drop below 235000KB since then (yet).
App hub: restarted on 1/23/2022. It is now at 239124KB but in just the past 2-3 days, it's started dropping below my warning (235000KB) and critical (223000KB) thresholds a few times (briefly). I expect it will need to be rebooted within a few days.
I edited a few rules and a couple dashboards tonight but, the past week or so, it's mostly just been hanging out doing hub things on its own.
I emailed support this since I'm seeing a lot of stability issues in v2.3.0.124. I just downgraded to 2.3.0.121 to see if they are resolved, but this is what I'm seeing:
Slow Downs and memory loss:
2.3.0.124 loses consistent amount of memory daily. In addition, the hub operation for every task gets consistently slower day by day.
- Once initial the system stabilizes memory wise, it's losing about 10-15kB/day
- Operations become slower. I was monitoring the execution time of one rule (basically the delay is from when the hub logs seeing the sensor report until it logs turning on the light (2 RM5 rules firing):
- Master Bathroom Door Multipurpose contact is closed (SmartThings wireless Zigbee, hub driver)
- RM5 rule sets/clears global contact sensor state boolean
- RM5 rule triggers Master Bathroom Lights (Lutron Wired Telnet)
On bootup, the time between that logged event of 1 to the logged event of 3 is about 0.5 seconds. Every day that grows by 0.5 seconds. By day 6, it takes 4.0 seconds to execute. During this time of the rule firing, its around 6AM, there is no activity in the house on any sensor since I'm the only person out of bed.
Once the hub reaches around 2 second delay, rule machine rules take 15-30 seconds to save. Editing driver code can take 30 seconds - 3 minutes to save. Sometimes it stops spinning the wheel and looks saved, but it actual did not. Hitting save again succeeds and that is typically quite fast.
In one of those worst cases, the log had an error of the hub unable to secure the DB lock.
Rule Machine 5 Condition Corruption
- I built up a rule with 15 conditions.
- I cloned the rule, and a condition checking a global variable value had the number deleted, and replaced with "null"
- While working on that same rule, I edited a condition from "var<3" and changed it to "var>2". Once that was saved, two other conditions randomly changed. Condition "state=0" went to "state=null", and a condition "temp<28" just deleted.
- NOTE: This is on day #4 of the system being up, and I am seeing a consistent 3 second execution delay from the above.
I've went as far as doing a soft reset, and DB restore. There is no change to the above. It does this consistently day after day, reboot after reboot.
There is a known reported bug with cloning some Conditional Actions, especially Simple Conditional actions. This is fixed in the next release.
Thanks for that update. I did see conditional variables having properties being deleted as well as full conditions just randomly being deleted as well (separate from the clone).
I'd save the rule, go back, and then there would be missing conditions.
I'm still seeing it on 2.3.0.121. Just reverted to a 3AM daily reboot while waiting for the next update.
I had very similar issue a couple years ago. I ended up scheduling reboots twice per week since after 3 days, slowdowns were very noticeable. An update came out, and it had been fine until recently.
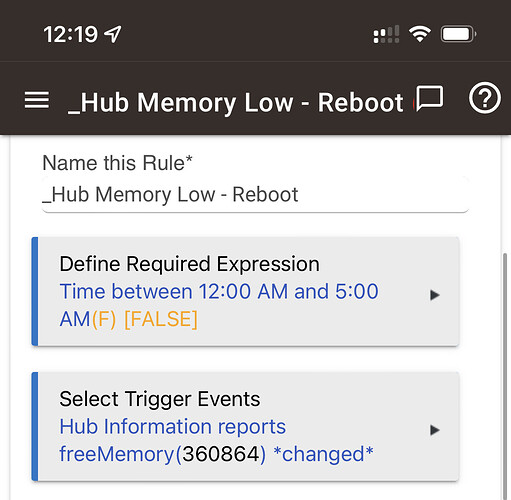
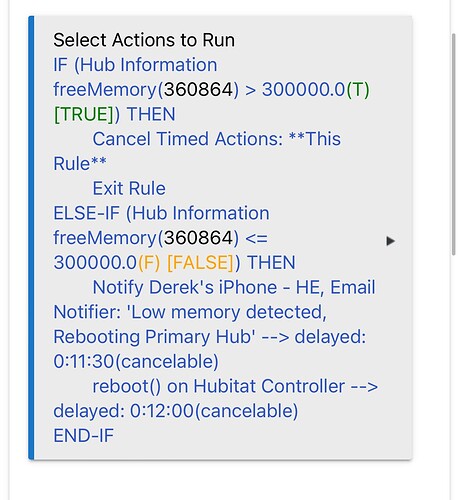
I solved this using the hub information driver and a rule to reboot my hubs once the ram gets below 300k - it’ll wait till between midnight and 5am to do the reboot so there isn’t any disruption.
That's clever! Totally slipped my mind that I could use the attribute from that driver!
I'm noticing once it's below 300k, the delays are very noticeable. Feels like it's running out of RAM and using the flash for swap space. 300k might not mean 300k for HE, might be a bunch ear marked for the OS.
It makes a huge difference keeping it above 300k, seems to be a real sweet spot.
@dJOS How often does your free memory update? Mine appears to update about every 5 minutes. For my hub, your rule would schedule three reboots before the first reboot happens. Have you noticed multiple reboots being scheduled or the hub rebooting multiple times?
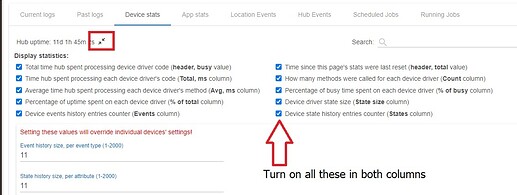
What is consuming all the memory? What does the App stats and Device stats show in the Logs tab? Turn on all the options (double arrows) for stats. Upload the whole page for both device and app stats.
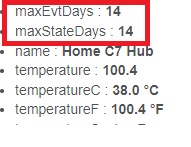
Also, what are your event history size and state history size from that Device stats settings menu?
Finally, do you have Hub Information Driver? What does this show for you?

Mine polls Every 5 mins.
My RM logic waits for 3 consecutive periods under 300k (over 12 mins) before rebooting so it’s not going to behave as you suggested.


