Hello,
I wanted to have a good morning greeting play at 7AM each morning which gave a weather forecast for the upcoming day - I had planned on doing this using Rules Engine. The challenge I had however was finding a reliable driver which gave a weather forecast (not just alerts) that I could use within the greeting. With this in mind, I set about creating my own...
Apologies if I am duplicating efforts that someone else has already done, I just couldn't find anything that worked for me.
Some of the key points of my driver:
- The driver pulls the forecast from the National Weather Service API (API Web Service) so no API keys are required.
- The driver uses the longitude and latitude settings from the hub (settings -> hub details) to determine the location and thus get the correct forecast.
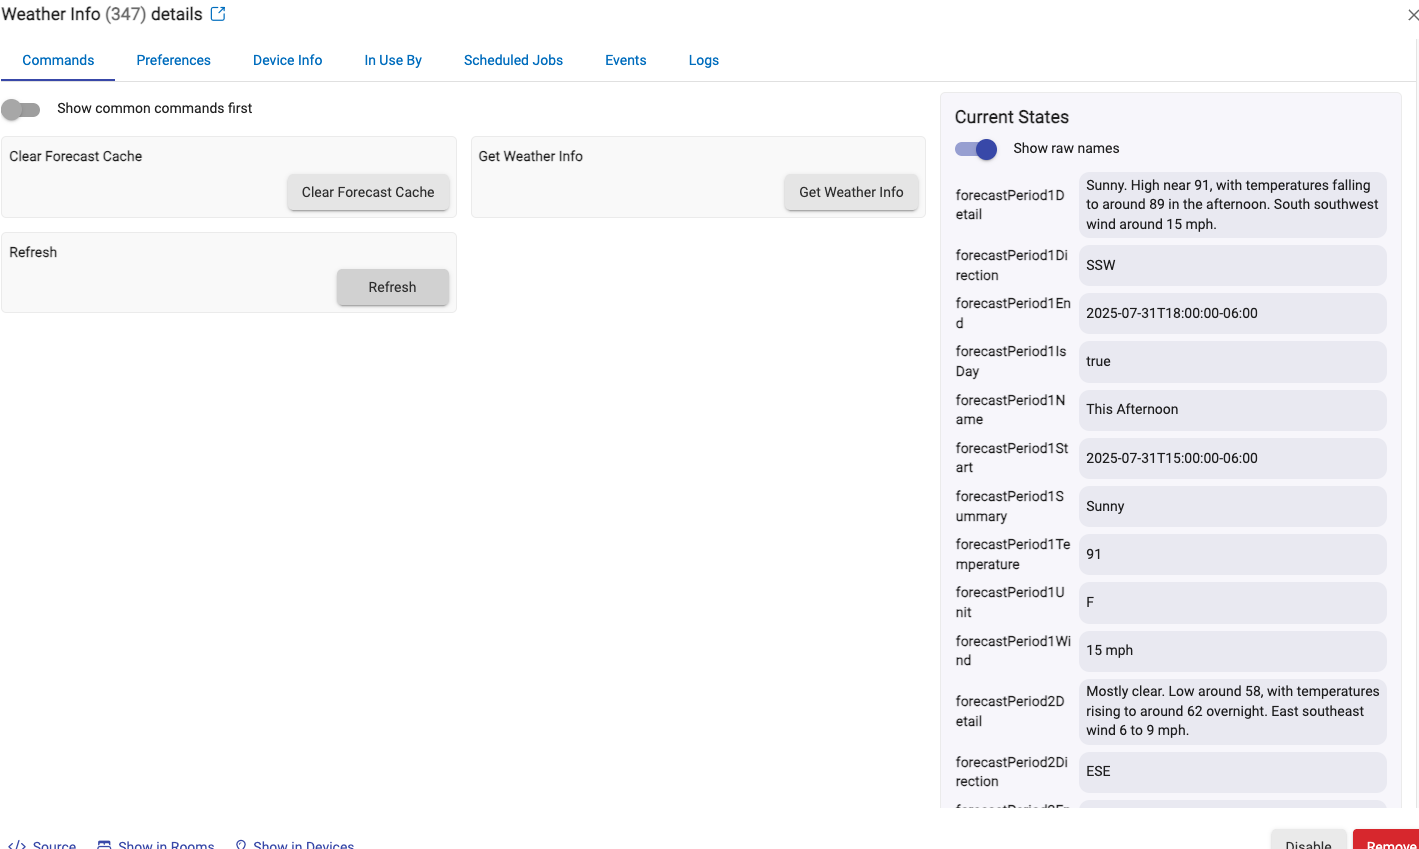
- The driver stores a bunch of data within Current States that can be used, but the most interesting one (at least for my use case) is ** weatherSummaryString** which is a human readable weather forecast that can be used in TTS situations for example.
Here's the direct link to the driver for importing purposes - https://raw.githubusercontent.com/b69ca/hubitat-drivers/main/nws-weather-info.groovy
Once you import the custom driver code, create a new device using the driver and then use Refresh to pull the latest forecast. The returned data (and populated properties) should look like this -
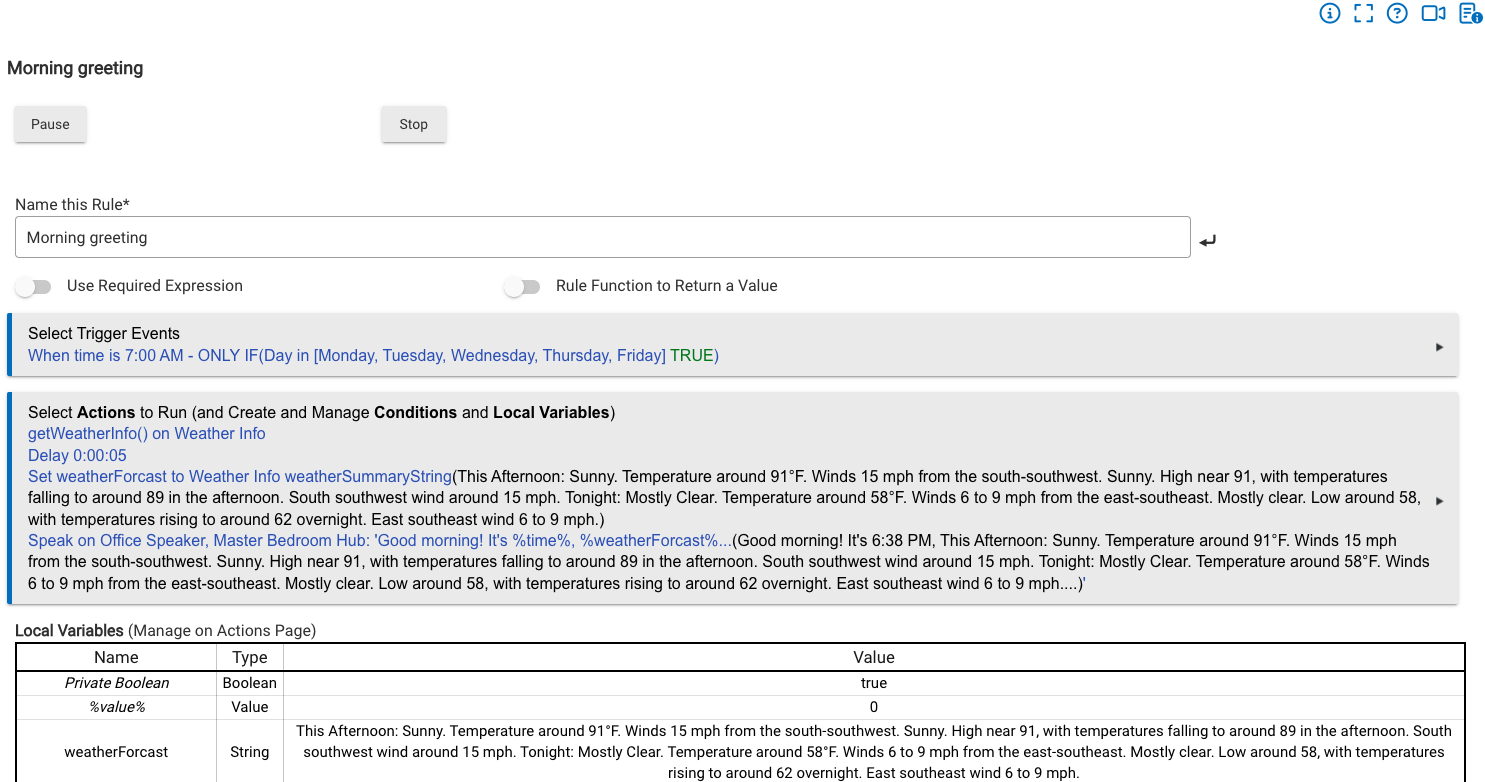
With this working, it's possible then to use this information in Rules Engine similar to the following:
Hopefully this is of use to someone...