As promised. Questions specific to that subflow should be asked there to prevent polluting this thread.
2 Likes
@fblackburn Question - when a command node has an error response, do the msg.requestCommand and msg.requestArguments still get populated and an output msg sent?
I had a flurry of command node errors this morning, but was unable to capture if there was an output from the command nodes or not - or what the msg structure was if there was an output. Just saw the errors in the debug log.
It would be good if the output was still created and if it has the msg.requestXXXX fields in the event of an error.
Here is one of the nodes:
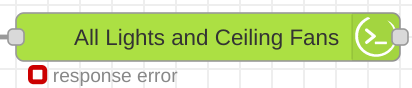
Oooooooooooooooooooooooooooooooh !!!! Seeing your subflow, now everything is clear about it ![]()
Well ... the answer is no
But as you said, it should definitively output something to leave user to make action if error. Probably something like msg.statusCode = 500 let me look other project and I'll add it.
Beside this, I'm curious about the error you had. Currently, we throttle requests to 4 simultaneously, because no one report error with this config. Should we decrease this number or it was out of nodes control? (ex: external node/script to Maker API)
If possible, it would be ideal to have the msg.requestXXXX in the error output too, so that my subflow could automatically re-try the command. Without the msg.requestXXXX info it will just stop/exit out as it does not have enough info to attempt the comparison or re-try.
I see errors fairly regularly during mode changes/finite events that trigger multiple commands at once. I've added a lot of random delay blocks in front of the commands to spread it out, but I still see errors on occasion. I'll try harder to capture the exact error - I just haven't found an easy way to catch it without actually sitting in front of it with node-red open though, which isn't exactly convenient...
Yeah sure ![]()
Everything should be in your NR log (or docker logs) tagged as:
[error] [hubitat command:<node-name>] [<node-id>] <interesting-message-error>
I don't run it in docker - pm2 on bare metal linux. I did find the pm2 logs, though. I need to comb through them and see if I can pinpoint one of the errors. 
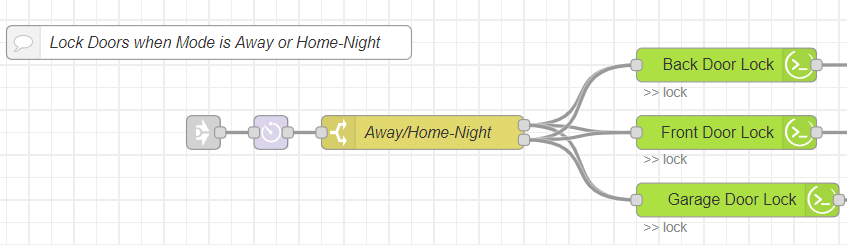
Here we go. This is a really simple one:
19 Apr 08:02:26 - [error] [hubitat command:Front Door Lock] [b5b846ac.116088] [deviceId:1513] http://192.168.2.161:80/apps/api/326/devices/1513/departed: Device not found or not authorized to send that command
19 Apr 08:02:26 - [error] [hubitat command:Garage Door Lock] [c730e508.b553c8] [deviceId:1493] http://192.168.2.161:80/apps/api/326/devices/1493/departed: Device not found or not authorized to send that command
19 Apr 08:02:26 - [error] [hubitat command:2473c26d.3b985e] [deviceId:1779] http://192.168.2.161:80/apps/api/326/devices/1779/departed: Device not found or not authorized to send that command
Hard coded / node properties setup on the command nodes. Set to command "lock".
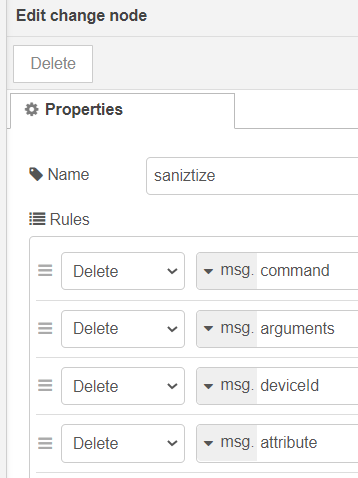
Based on the error, it looks like there may be a msg.command and/or msg.arguments getting passed to it from somewhere else in the msg chain - as there should not be a "departed" on it at all... I'll add some nodes to 'sanitize' the msg before it gets to the command nodes by removing msg.command, msg.arguments, and msg.deviceId.
1 Like
Looking through my (admittedly fairly complex) msg chain, I still can't figure out where the "departed" came from at all. But I'll keep looking. EDIT: Found it, and yes it propagated from about 5 previous flows deep - had to walk my way back through it.
The sanitize block below would have fixed it. I'll start adding that after command nodes/msg chains that go to a lot of other flows/nodes just to be safe.
Maybe msg.command, msg.arguments, msg.deviceId, msg.attribute should get stripped off the output msg from the command node? Regardless, my sanitize node will fix it.
Sanitize change node:
1 Like
FYI @fblackburn every error I saw in my logs (I looked at the past week or so) was due to unintended msg.command propagation.
I didn't find any evidence that there is rate limiter/too many commands at the same time issue. So that's good!
1 Like
@JasonJoel here's the PR for msg.responseStatus, any feedback is welcome
Maybe with the msg.requestXXX variables, these attributes are not really useful anymore. The only thing that make me hesitate, is that no builtin nodes (ex: http request) sanitize its input. It always forward input attributes to the output message. I opened an issue to write thoughts
Updated node red today and now I can not see devices under under property.
If i add a new device from hubitat I can not select a device under properties.
Checked API and all is right.
Does anyone have an idea to check?
All my nodes are working still but all devices and commands can not see devices from hubitat.
In 1.7.0, duplicate javascript code have been moved to a common file. Then you may need to force refresh your page (or try private navigation to test)
Otherwise, if you open the browser debugger (F12) and you look at the network tab when you open a device node. you should see a request with an error.
You can also look at the NR log to see more info (the location depends on your installation, the following command should output the log sudo journalctl -f -u nodered -o cat)
that fixed it. I hit F12 and clicked refresh and the devices show up now.
Thanks alot
1 Like
I agree. I would leave it as-is to be consistent.
1 Like
Not working again. restored my last backup and node red would work.
Updated node red and I'm getting the same as above. I tried f12 and looked at network and that seemed ok. No errors.
Still cant see any devices from hubitat.
I did find error below.
DevTools failed to load SourceMap: Could not load content for http://xxxx.xxx:1880/vendor/purify.min.js.map: HTTP error: status code 404, net::ERR_HTTP_RESPONSE_CODE_FAILURE
Couple of things to try:
#1 Stop node-red and then restart it (node-red-stop, node-red-start)
#2 Refresh the webhook in the configuration node
Generally one of these will cure the problem for me.
No go. Stopped and Started and refreshed the webhook.
I guess I'll just restore from backup.
and try again when I have more time.
Thanks for the help.
Restored yesterdays backup and working again.
Just curious - would the "Catch" node trap it? I have a few flows that write to a MySQL DB and I rebooted the computer that hosts the db forgetting to pause these flows. I got spammed by my error handler! I haven't used it in my HE flows and I'm wondering if I should...
Maybe. Even then, though, you would still need to send it somewhere to view the full details - to a file, pushover, somewhere. Not as necessary now that I found the full PM2 logs so can just go look... 
Yeah - I already have a "Notification" sub-flow using Pushover (transitioning to SMS/Email) that I use when some scheduled flows run (backup, restart etc.), so I would just use that.
2 Likes

