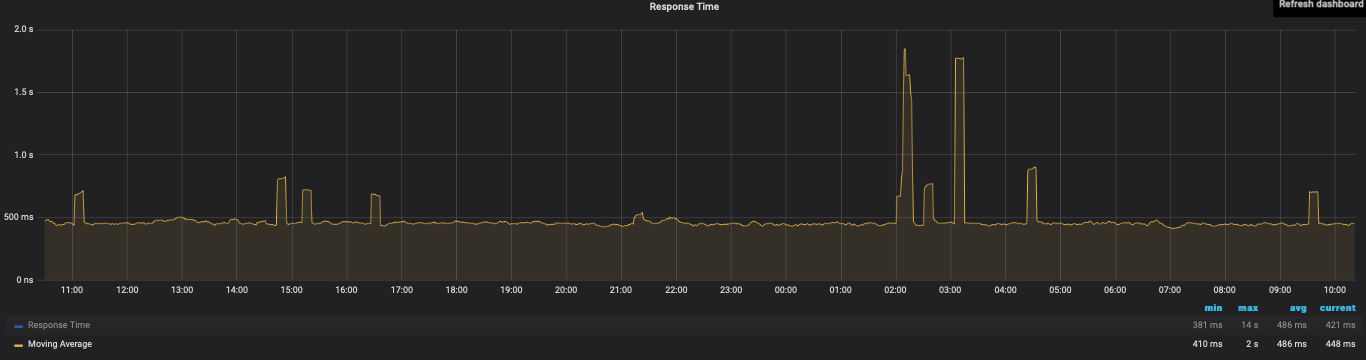
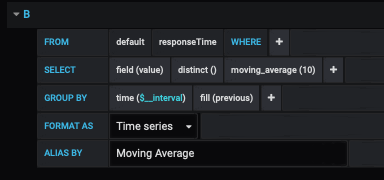
I use a moving average to smooth out the data.
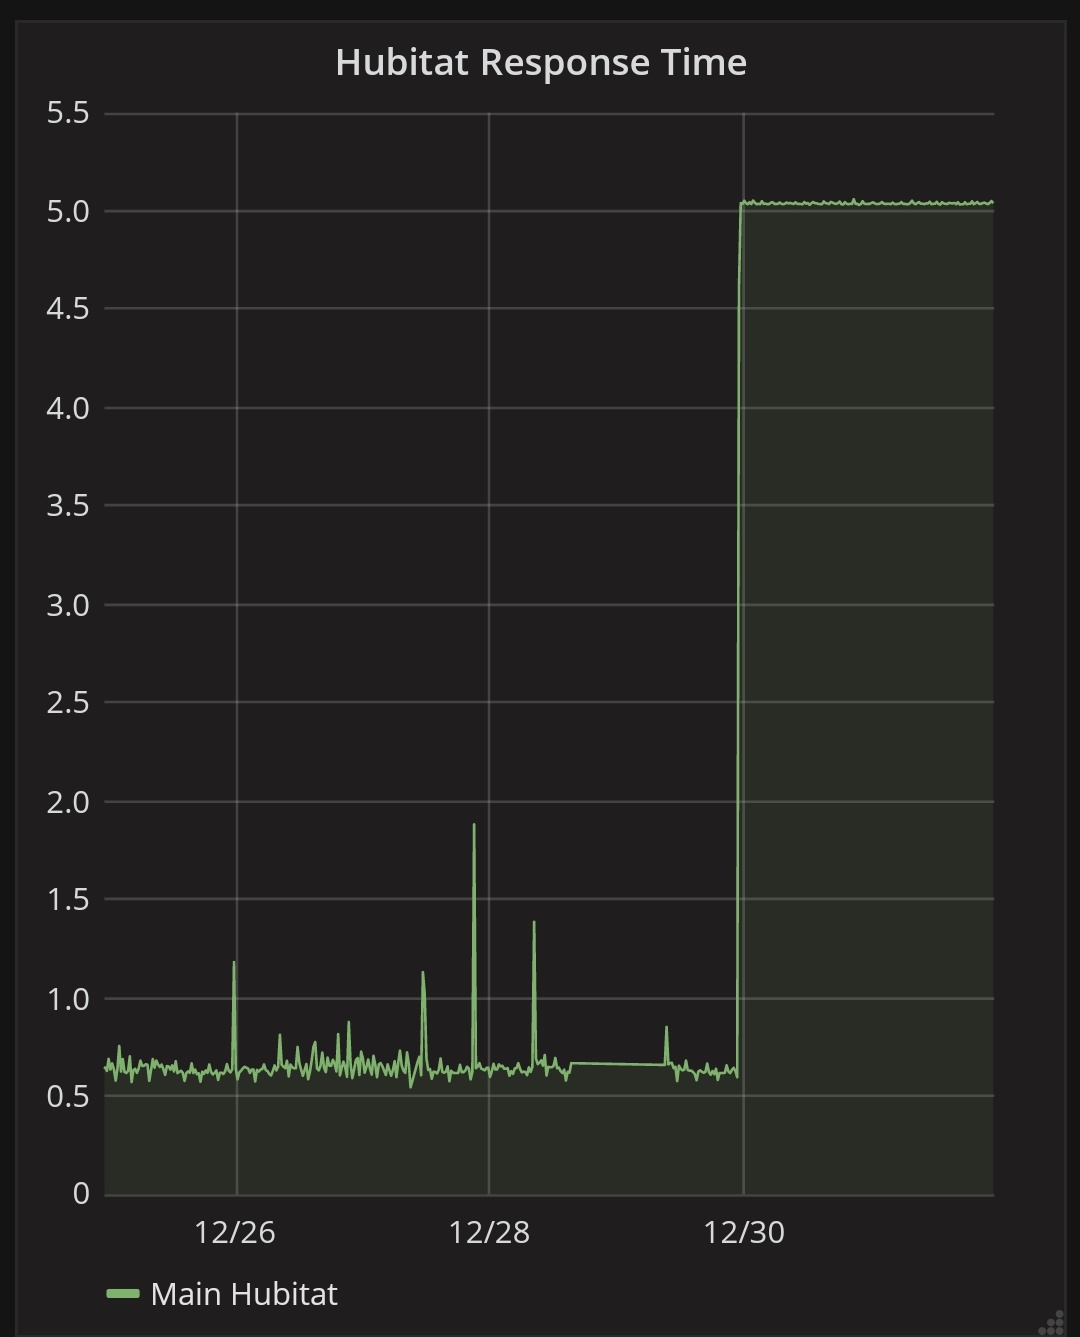
So I moved node red from my NAS to a raspberry pi 3 and the hubitat response time changed from ~.5 seconds to about 5 seconds. Why that is the case on a mostly idle Pi is probably a question that needs to be discussed elsewhere but I just wanted to point out that the Hubitat performance might not be the only thing being measured here.
Anyone notice reboots not helping? I have my performance monitor set up to reboot if the response time goes above a threshold, but the hubip/reboot command does not help.
Rebooting from the hub page manually does not improve things either.
The only thing that helps (for about a week before the high response times return) is to reboot via the diagnostics page (hubip:8081).
I know the right solution is to find what is causing the slow down, and I am working on that, but what is different about the two reboots? Is there a way to automate the 8081 reboot? It is past my knowledge to load a page then pass a mac address using nodeRED
Question... Why are we using both MySql and Influxdb in this flow? Is there a specific reason for using both instead of just placing it all into influx? Im sure there is but at the moment my brain just can't place it, so can someone please enlighten me.
Inquiring minds want to know the same question @btk. Can we just use influxdb?
Yes I do. I just removed the MySQL bits from the flow.
I do use MySQL in other flows and for historic event logging.
Looks like we miss logging reboot logs if we do this.
I took the MySQL bits out and added an optional Free Memory log (new in 2.2.3 - /hub/advanced/freeOSMemory). Nothing is being done with this data as far as checking it for a certain amount - it's just being logged to influxdb. I also added a few variables so that I can distinguish between which of my hubs is being acted upon within the pushover alerts.
Here are my exported flows: Hubitat Performance Monitor w/ Free Mem logging
Nice I added this too last week. Just another data point in my Grafana dashboard.
thx for the tip, upgraded mine to grab freeOSMemory as well. Curious what you guys are seeing?
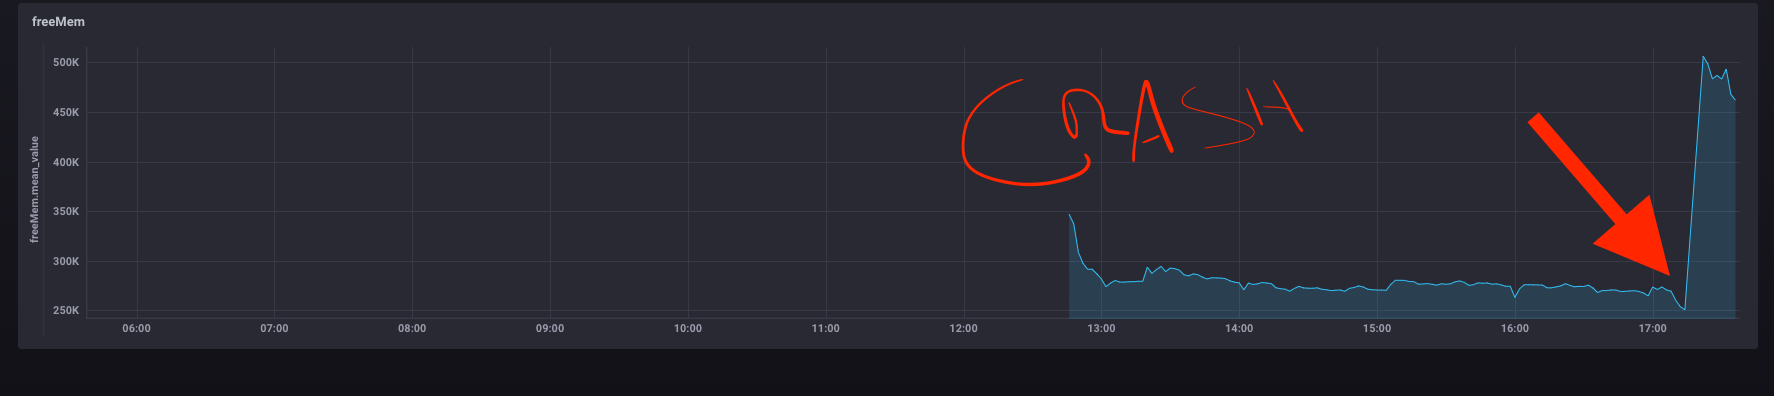
Hub is crashing randomly and the responseTime never spikes or creeps up, so trying to figure out if memory is culprit. Tho I gotta believe there's some kind of garbage collection going on.
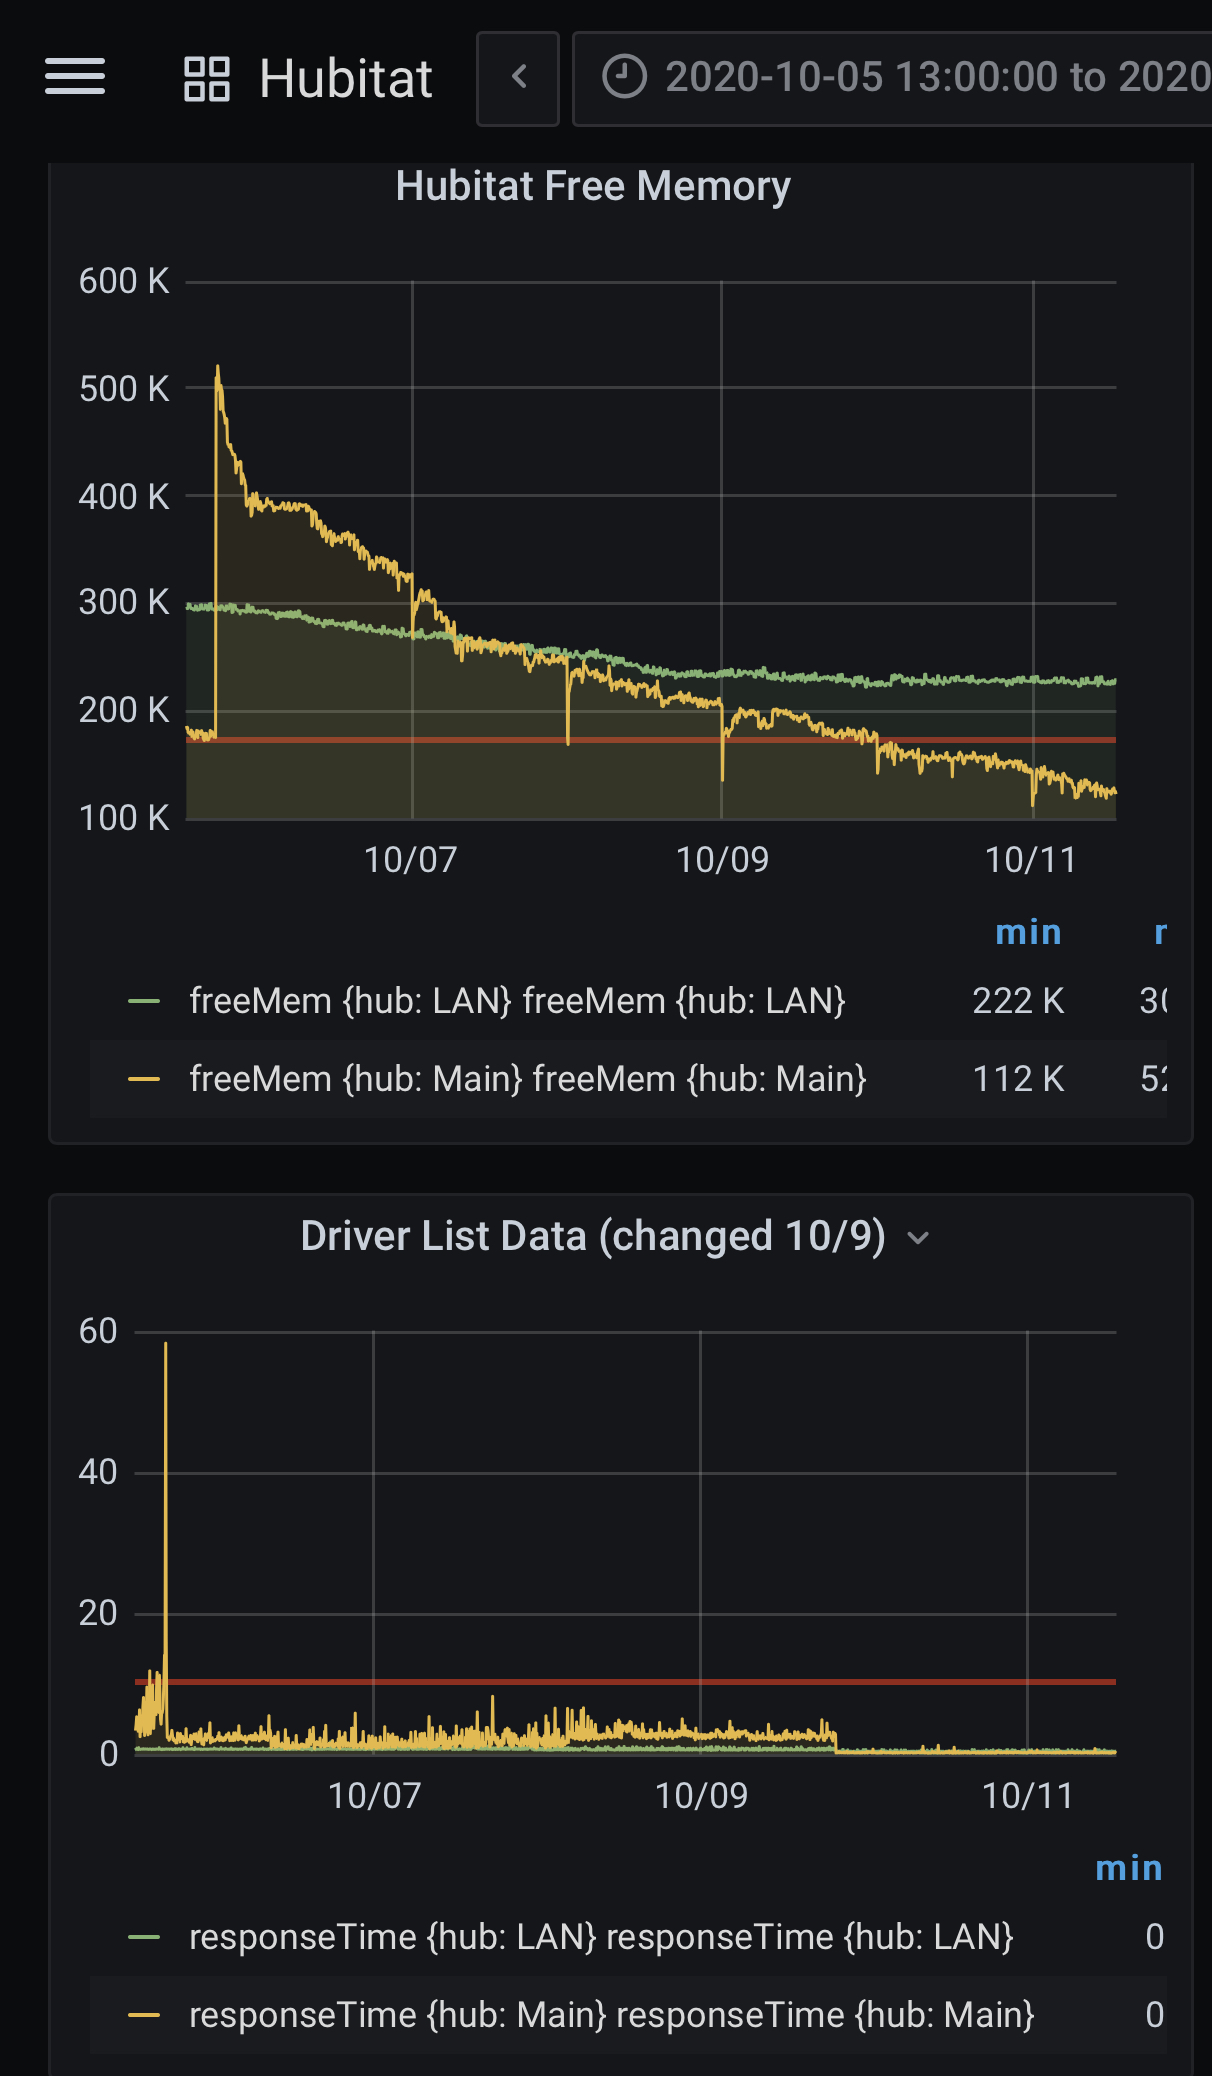
I’m having issues as well. I changed the apps page list to query /driver/list/data URI instead, per support “It returns a list of device types, and it goes directly to the database every time”. You can tell where I made the change here - 2nd graph midway though 10/9:
Also you can see where my device rebooted last week on the top graph.
Good thing is I’m working with support, they have been very receptive and helpful and hoping some changes they have been doing will help in upcoming releases.
Yea, I've had a ticket open for 2-3 weeks now.
At first it was, "Your chromecast devices are causing the hub to freeze"
They weren't.
Then it was, "Your hub is overheating"
It wasn't.
Am now with engineering but they haven't contacted me since receiving the ticket. So trying to get as much information on my own as I can.
Currently modifying the flow to reboot if memory gets too low. Will see how that goes. Am new to node red so this will be a good exercise for me.
Ooo. Share if you’re successful. Too many moving parts for me to try and add the logic for both. Good luck.
btw, thx for the heads up on /driver/list/data
I am also seeing much lower response times since switching.
Will monitor this for a while, but since support told you it was better to hit this, wondering if we need to lower the thresholds in the config currently at 5s/15s?
I agree they probably need to be lowered. No data yet to know what to.
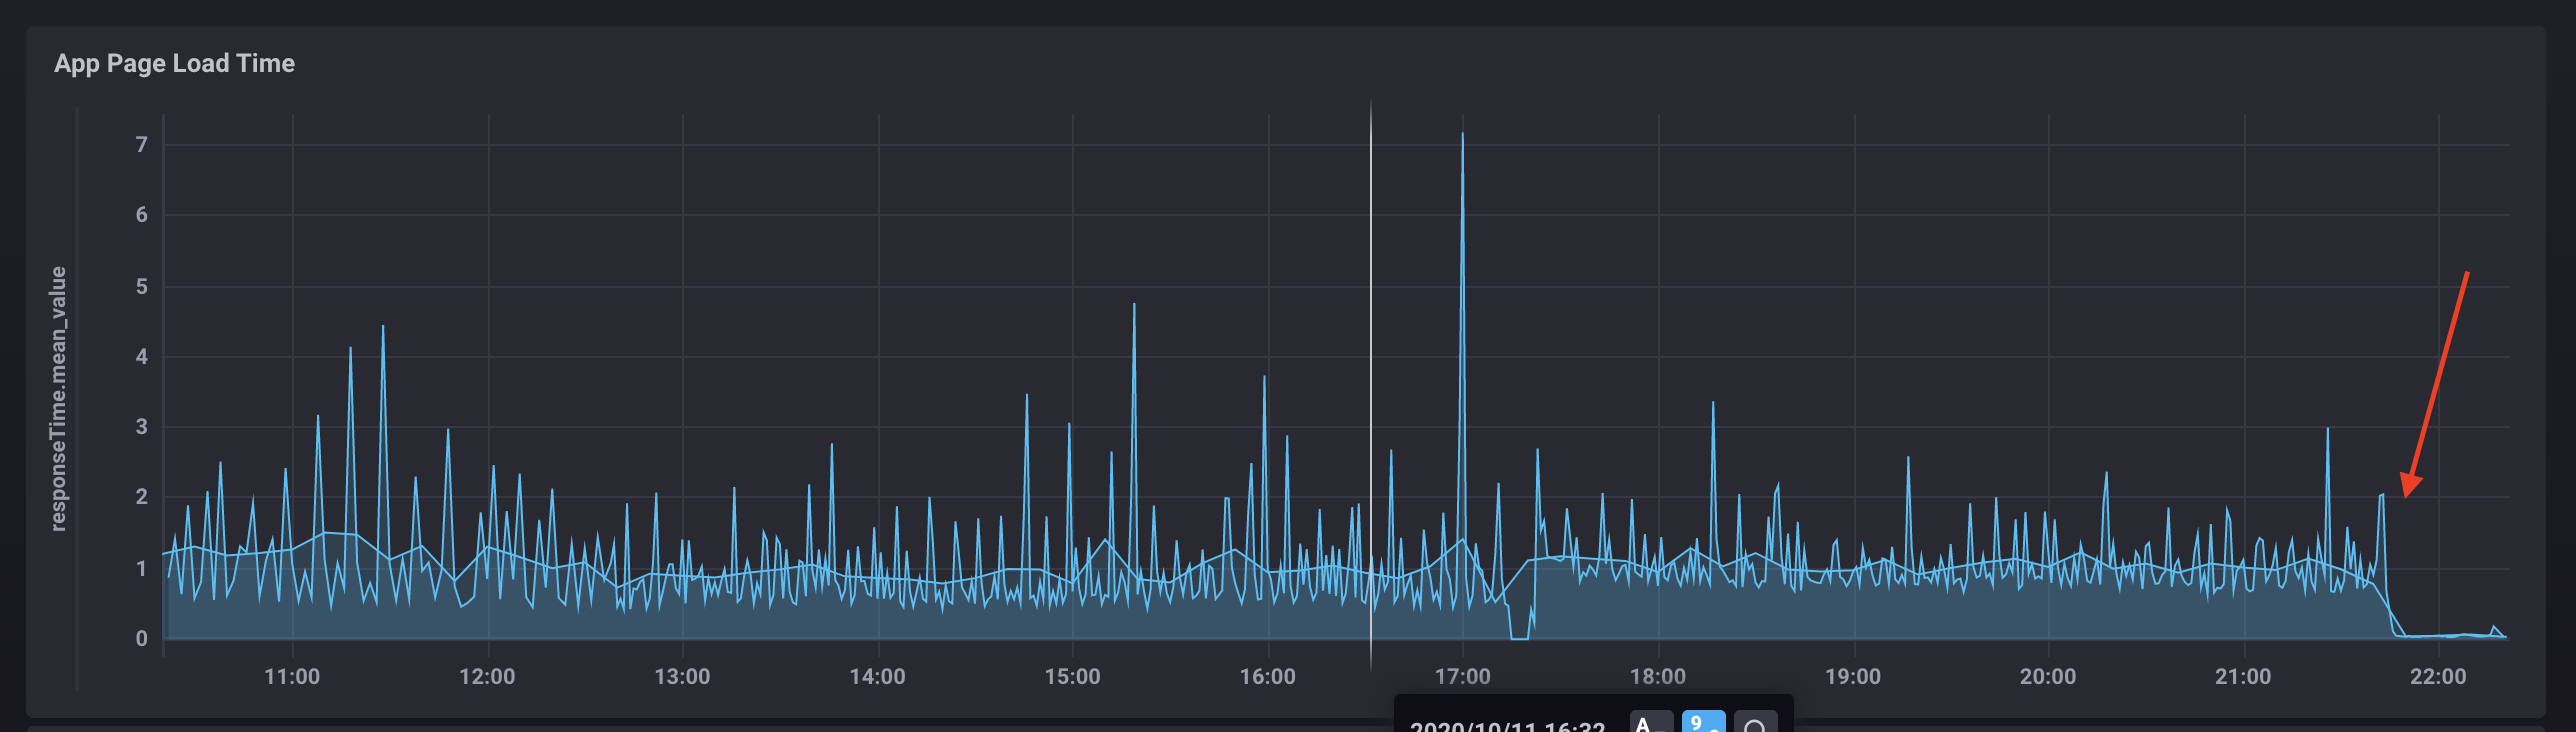
The problem I see with using /driver/list/data is there doesn't seem to be enough of a warning threshold where you can be successful in triggering a reboot. This was last night. It went from .20 to 24 response time. I was unable to trigger a reboot so I had to power cycle it this morning. Curious if you're seeing similar data?
I'm no closer to diagnosing my hub slowdowns unfortunately.
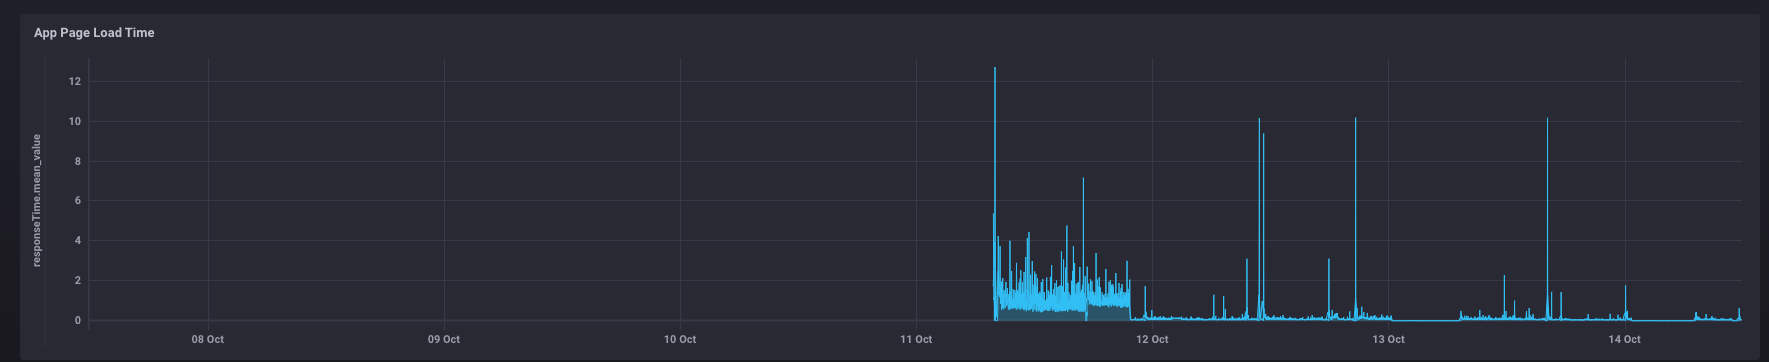
Agree that /driver/list/data response time is low when it's working. But just as with the Apps List that the original Flow used, I can discern no rise in response times before my hub spontaneously goes unresponsive.
You can see when I switched over from the apps list on 12 Oct. All the response time spikes were associated with hub power cycles.
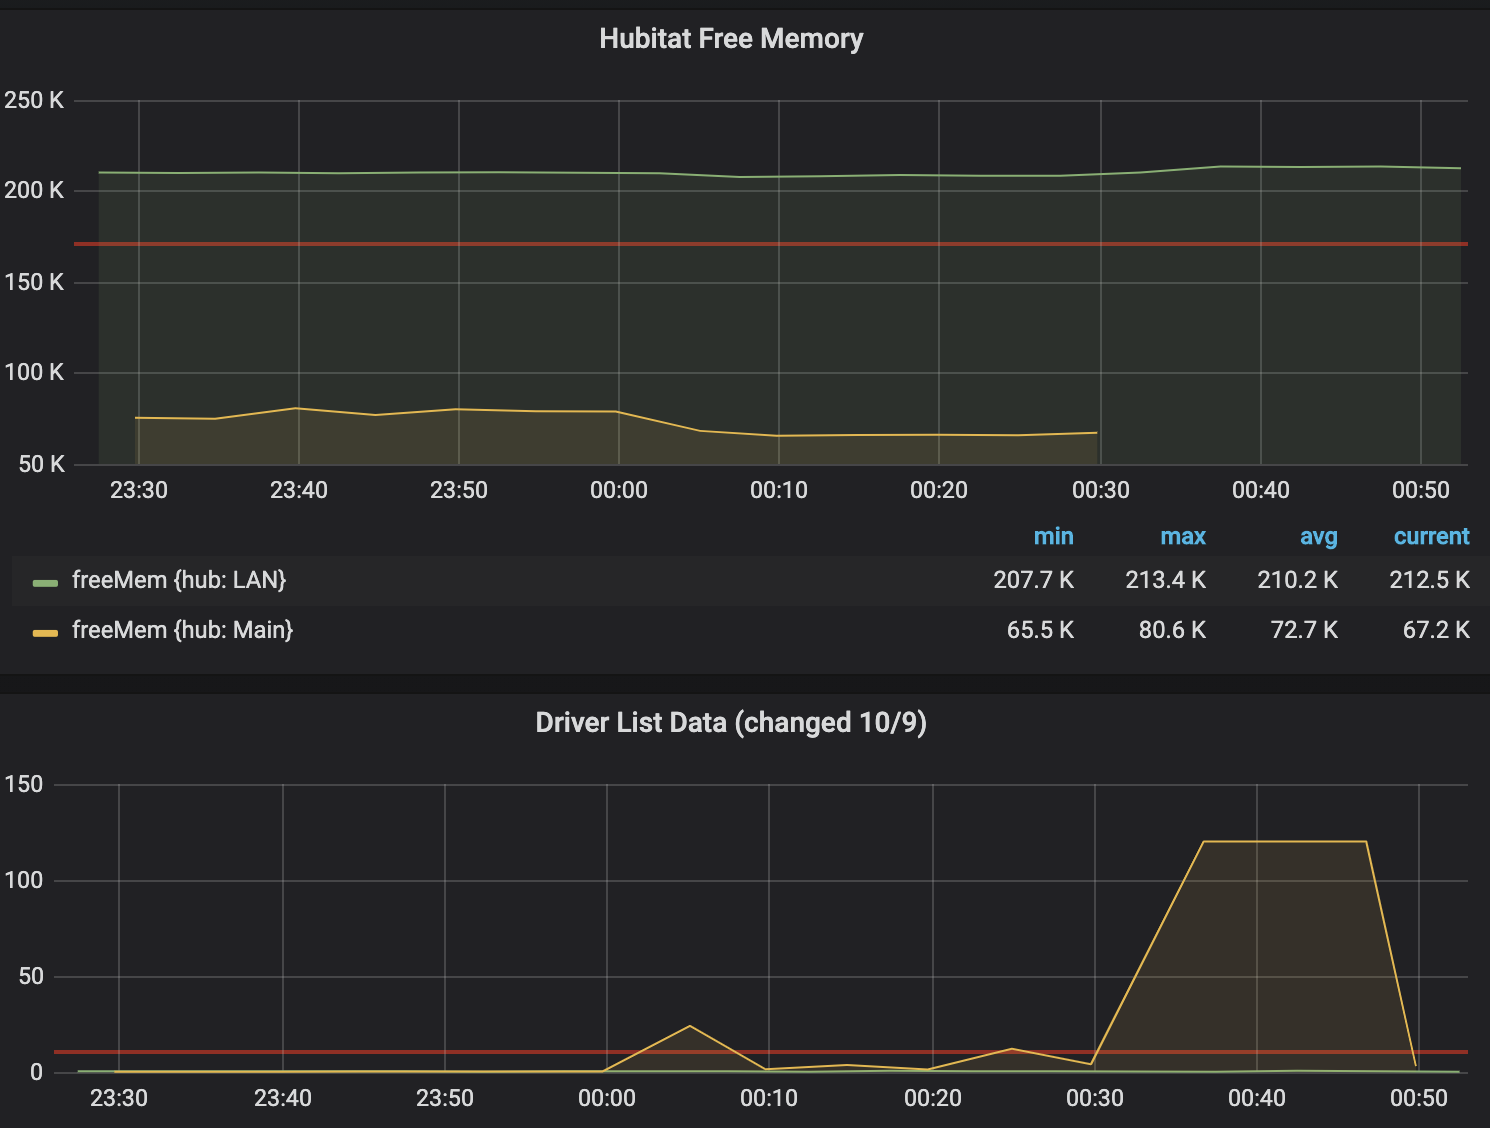
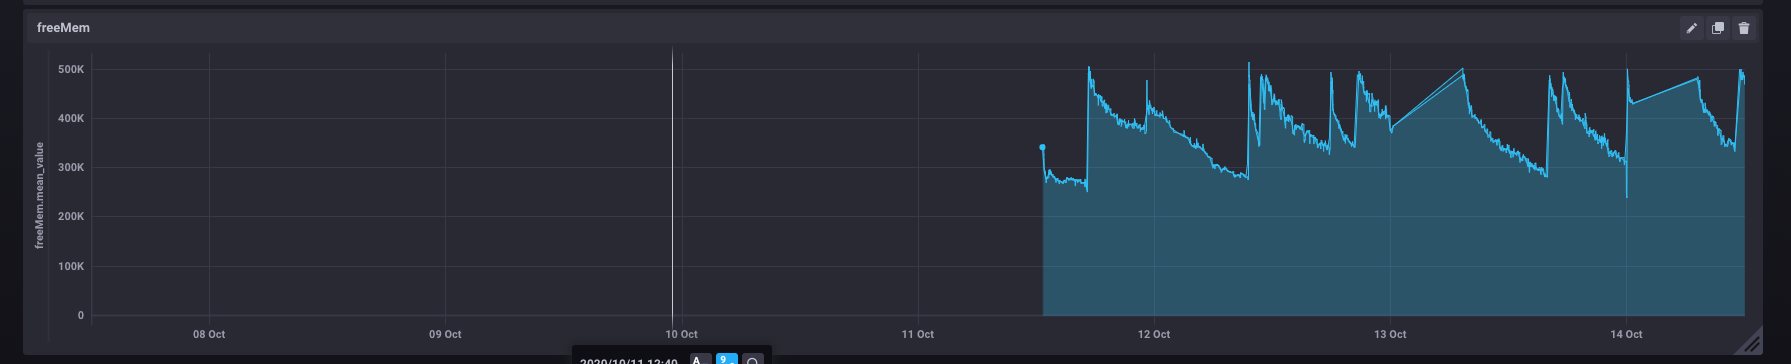
Same with Free Memory. I did modify the script to reboot the hub if memory gets too low, but that didn't stop the hub from randomly going unresponsive. I had set the flow to reboot the hub when it falls below 275K, but it looks like both of your hubs are running ok, and well below that. It is interesting to me that your hubs seem to have stabilized on free memory and mine keep falling after a reboot.
Some good news... using one of these smart plugs (wifi - no hub affiliation) and the easy to use node-red-contrib-tplink, my flow can now detect when the hub has gone unresponsive and power cycle the hub.
It doesn't solve the hub freeze problem, but hoping it will reduce down time and manual interventions. I've been running it for all of 30 minutes so will take a few days to observe.
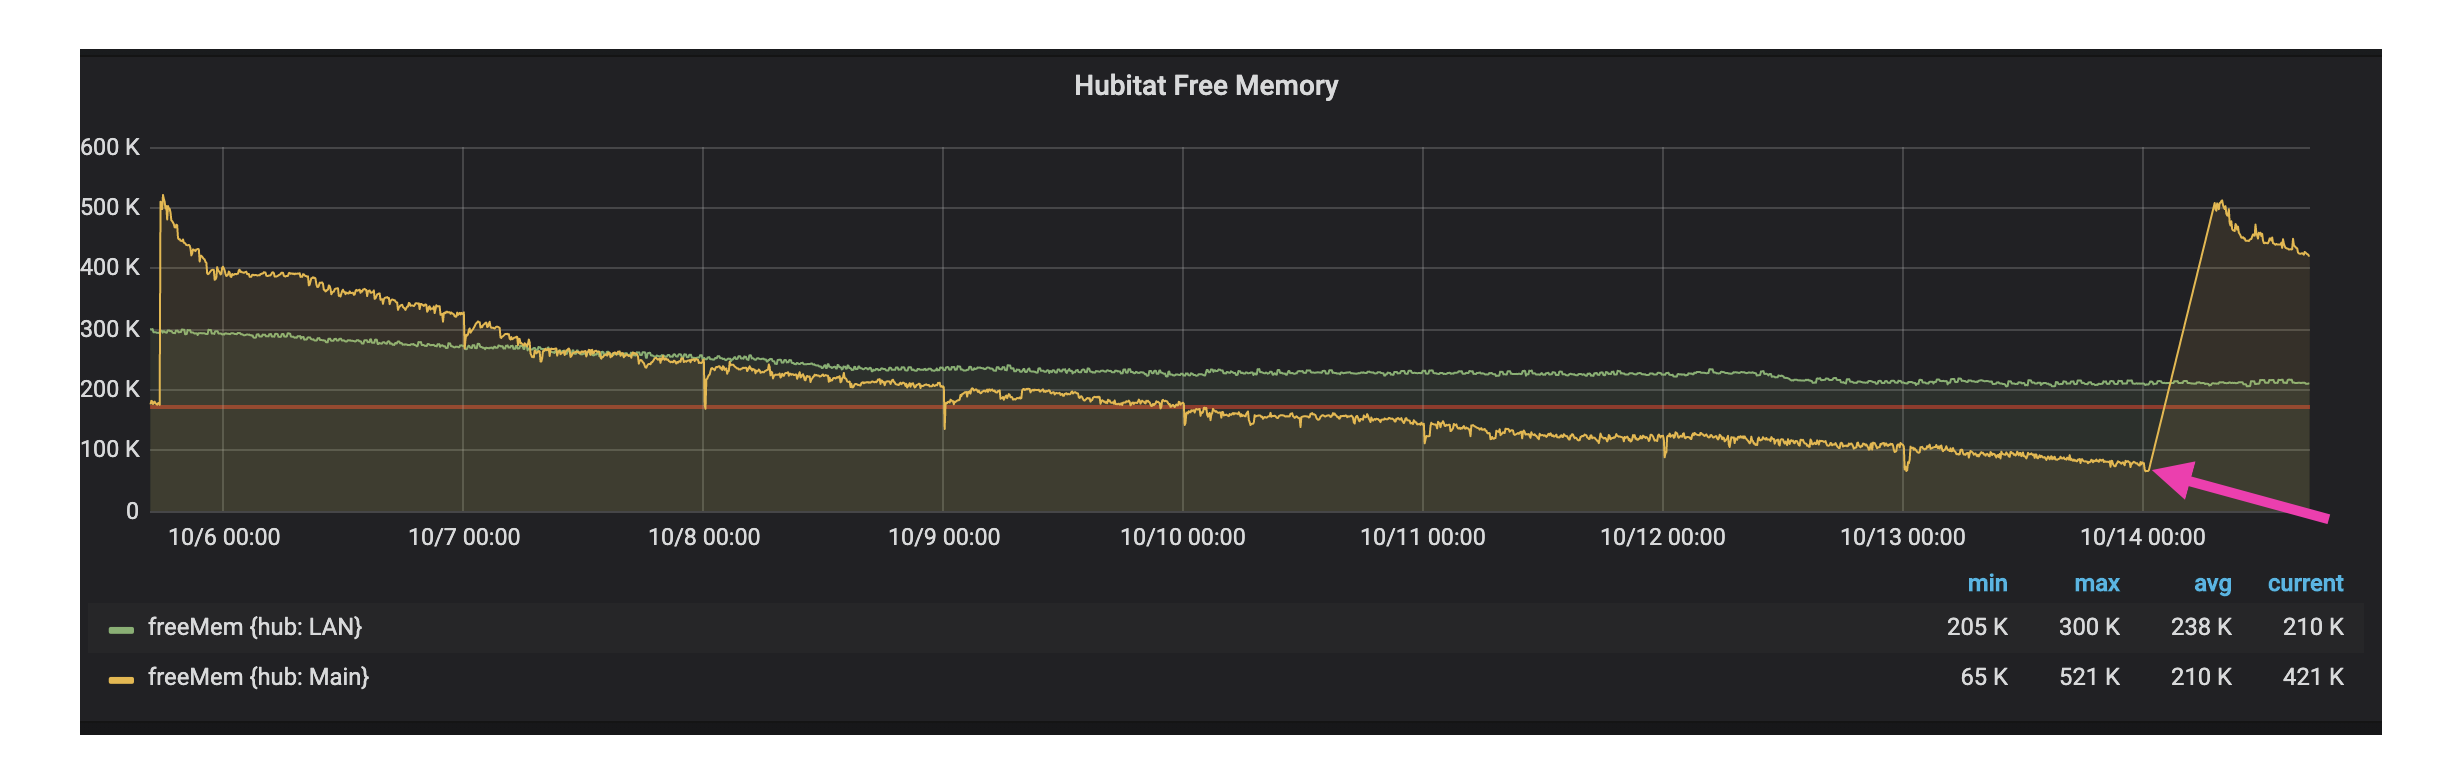
I’d be interested in your flows of you can share. I have a similar tasmota plug which I can control outside of hubitat too. Also being able to force a reboot based on memory seems like it would work for me - I can see where the dip that happens every night at midnight was when my system died. 65.5 was my lowest point.
Happy to share when it's stable. Still have a couple bugs to work out.
I'm in a better place with my hub. Still can't pin point the exact cause of my hub going unresponsive. At it's worst, I was having to power cycle the hub 4-5x a day.
A few things I've done that seems to help stabilize the hub.
Download the Hubitat app