@btk I ran into an issue last night where my device didn't reboot. Looks like I did receive errors about unable to retrieve the App Listing URL. Is there a way to check for host unreachable and set the response time as high if it can't reach the host? I know I can't issue a reboot via URL, but I'd like to call a HTTP call to a tasmota outlet to reset the device.
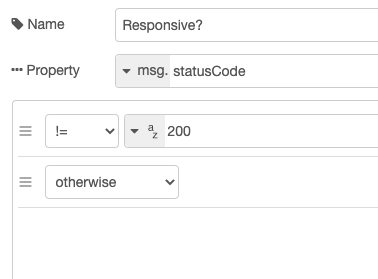
@brianwilson My flow just checked the http status code. If it wasn't 200, consider the device unresponsive.
BTW, my C4 hub is completely dead now. Blue light comes on but it never gets an IP so I can't get to the UI. Can't count anything out, but I have 67 other wired/wireless devices in the house working great so I don't think it's the network.
Unfortunately, support was not helpful. I've had a ticket open since 9/15 with no resolution and they've stopped responding.
While I'm not crazy about that, I did go ahead and order a C7. Will try and restore / repair this weekend.
Wanted to share my version of @btk's flow performance flow. This has support for checking free memory and will reboot if memory is below a marked threshold.
This is a great tool to get the data into influx deb @brianwilson. Is there a reason you left of the information about the JVM and are only capturing the data for the OS Memory. I have seen the JVM data fluctuate a good amount as well.
I am trying to figure out how to add the free Java memory value as well and i can't for the life of me figure out how Node Red is pulling just the Free OS Memory based on the flow. I am sure it is some inhearated info through the flow, If that could be added easily it may be also to view that at the same time
OK I see where my confusion was. I didn't realize that a URL was created just to show the Free OS Memory. I thought you were pulling from the other URL I had seen with the history and only loading the last record. That has total JVM memory and Free JVM memory in it.
I would also be interested to see how many cached or stored device, app, location, and hub events are being cached. I wonder if he various logs could be filling up and causing the issue.