got everything setup using the info from this thread and the other thread for mysql. added the table with the query above.
Im getting this error in node red. Everything else appears to be working. Error: ER_TRUNCATED_WRONG_VALUE_FOR_FIELD: Incorrect decimal value: 'undefined' for column hubitat_logging.responsetimes.value at row 1
This appears to have fixed it for me. I am new to node red. So when i tried it the first few times I didnt re-deploy the node so it appeared the error was still happening.
Tip for node-red noobs - redeploy after changes.
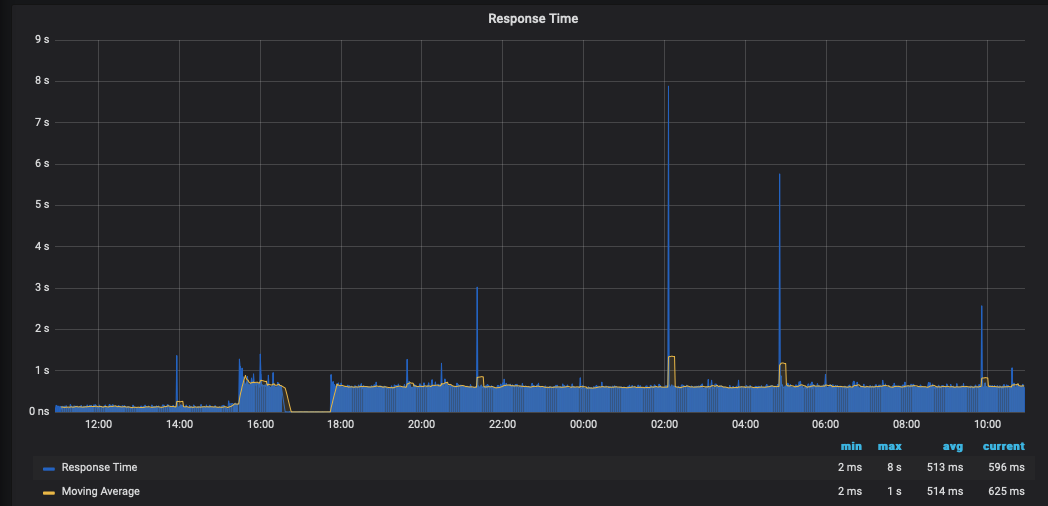
Anyone noticed significantly higher response time after the 2.1 update? I used to have minima of 70ms, now its more like 500ms. I updated at 15:15 yesterday.
Sorry it has taken me so long to get back to this. I am trying to configure the websocket to right to the influxdb I have running and am getting this error: "Error: A 400 Bad Request error occurred: {"error":"unable to parse 'undefined,hub=HE1,deviceId=undefined,displayName=undefined,unit=undefined value=NaN 1559671660': invalid number"}". I am having trouble getting screen shots b/c I am remoted in at the moment but can get some later if needed.
Anyone doing this with multiple hubs? If so, are you just making a set of mariadb tables for each hub, a separate mariadb instance for each hub, other?
Right now I'm thinking I'll just add a hubId field (and populate it with a value that makes sense) to each table and do it in one set of tables.
If you are using the shared template above, I believe you can easily change the hubId in the function node directly before the Influxdb node.
That is essentially what I did for my hubs. I setup my main hub and did a straight copy and paste...only had to change the IP address and hubid I believe.
Edit: you would also have to update the output log locations..I did this a while back and have made many small refinements so I can't quite remember all the areas you may have to tweak. Long story short...you should go through the nodes and tweak any hub specific sections. It shouldn't take long...but for the database side, it should only be the hubId in the function node I mentioned above.
I'm making a number of changes on my flows - pushing hub specific items like access token, appid, etc into a config block... Changing the URL creation to use those variables, etc.
Unfortunately I'm stuck on the MySQL connection to my mariadb - keep getting access denied. So I need to get that resolved first.
EDIT: Never mind, fixed the access issue - user error.
I got this all set up and it is mostly working. Thanks for all the work others have done, this is awesome. A couple questions though that are probably user error, or me not understanding something:
The inject to start the whole thing only runs when I click it. It does not repeat every 5 minute. I have changed it to lower numbers and it still doesn't run on an interval.
No log files are being created. I made a directory for them to go in and I think I set up permissions for that folder, but no files are made in it. I don't fully understand Ubuntu (just smart enough to be dangerous).
What is everyone using to view the MySQL tables? I can confirm it is writing to them, but the Grafana MySQL plug-in and table and log panels don't really let you view the logs. I got influxDB working for the graphs though.
Thanks for any help, starting to pull my hair out with these last issues.
The inject to start the whole thing only runs when I click it. It does not repeat every 5 minute. I have changed it to lower numbers and it still doesn't run on an interval.
There was a check box in the inject node to "inject after 0.1 seconds" that needed checked. Did not check by default.
No log files are being created. I made a directory for them to go in and I think I set up permissions for that folder, but no files are made in it. I don't fully understand Ubuntu (just smart enough to be dangerous).
Don't use the Ubuntu Software Installer (Snap). It doesn't have the same permissions as normal installs of Node Red. It can be fixed, but it seems no one uses this install method, so not much help out there
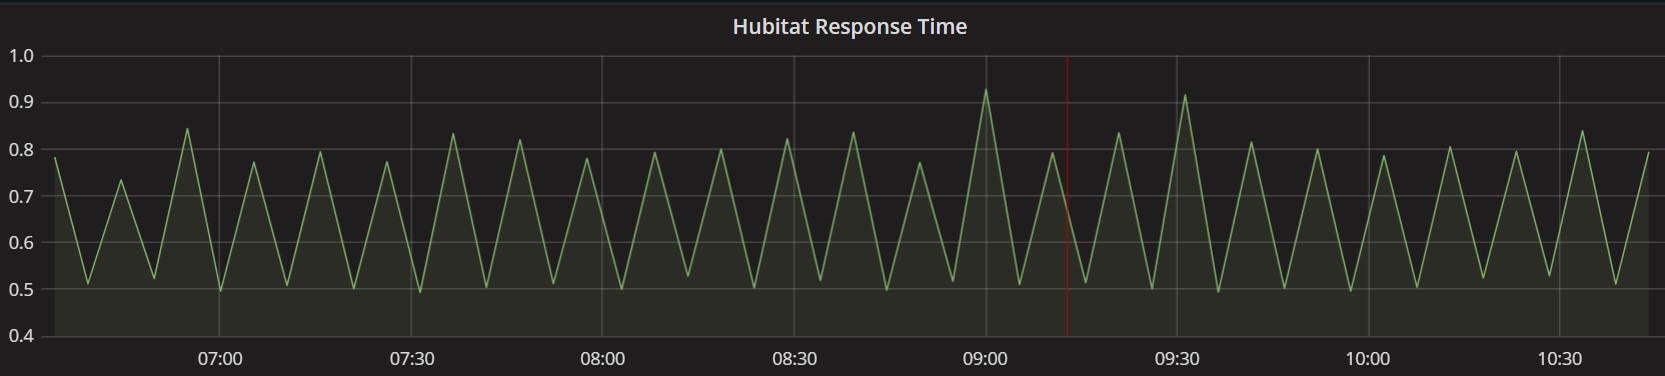
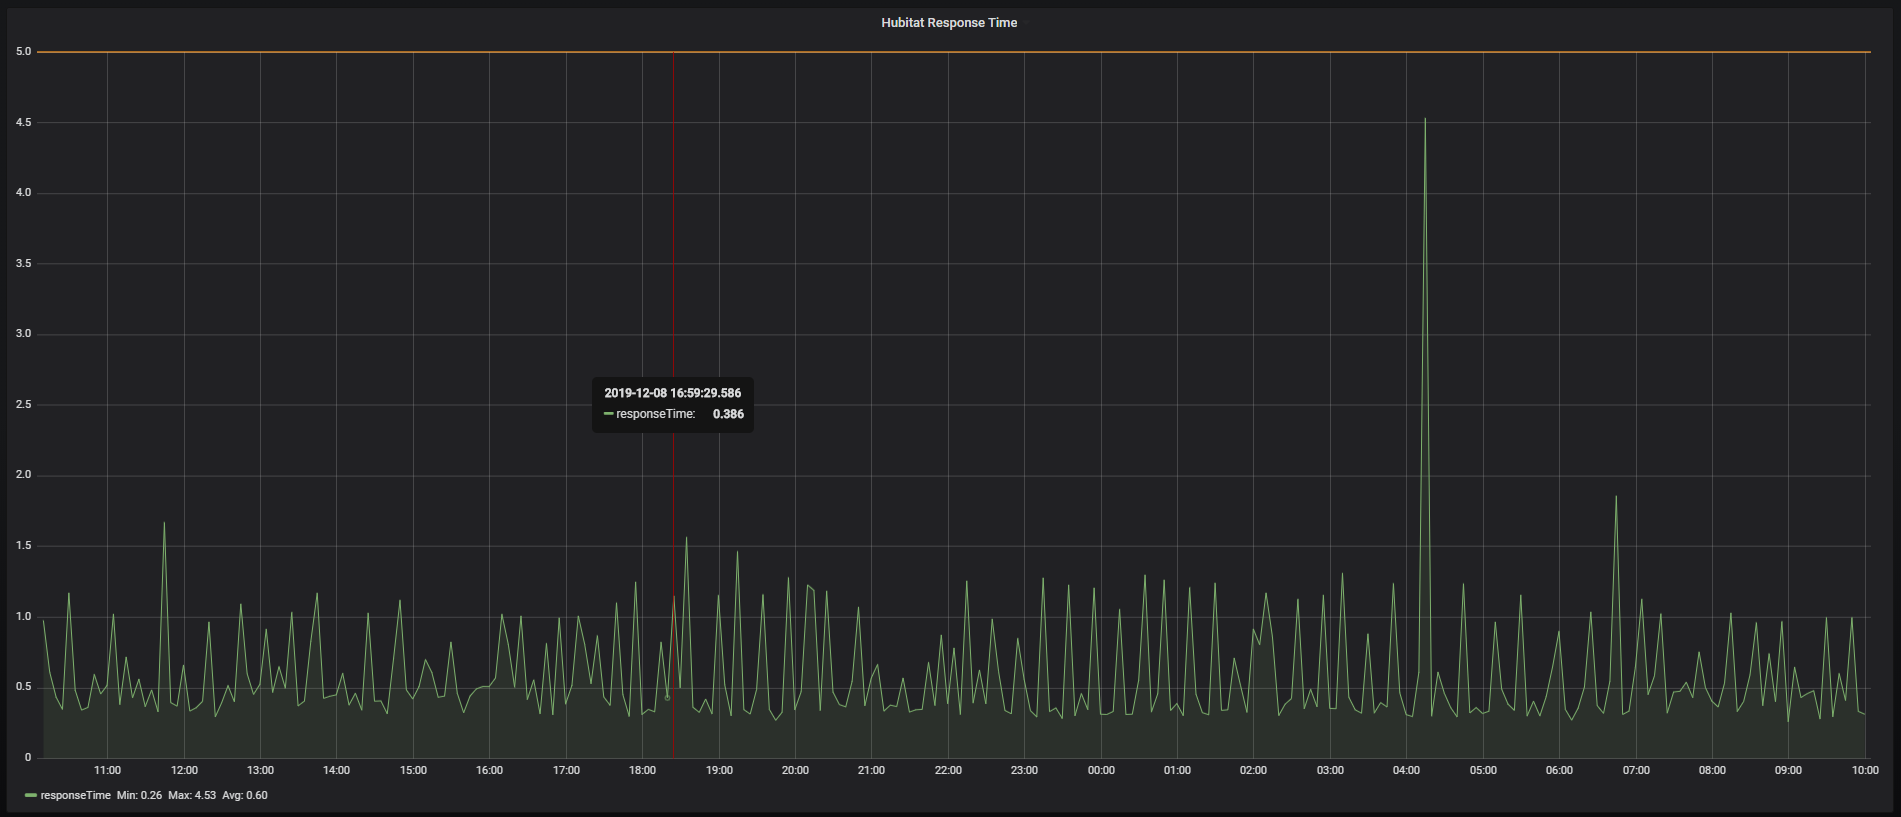
So, what is everybody's response time? Mine alternates like clockwork between .5 seconds and .8 seconds. Anyone else have this consistent zig-zag line?
Is it possible that the hub caches the requested web page for a certain time so that every other request is a little faster?
Interesting results but I don't see anything to be concerned about. Could also have to do something with NR delays. I'd say you are in good shape if you see this on a consistent basis. We don't use scientific tools here that would guarantee us a consistent result on every run