Node-Red Dashboard help - Text

Node Red gurus! Was wondering if anybody could help me with a little dashboard help...

I've got some nodes that store devices in an array that haven't reported in a specified time period. However, when I try to display that in a text node in the dashboard, depending on how many devices there are, it extends past the border. It's not a huge issue, but it looks craptastic.

Has anyone found a way around this?

Currently passing this notation for line breaks:

<p>Device1</p>
<p>Device2</p>

I've tried <br> and <div>, but no luck. And size is set to auto

Thanks!
image

1 Like

Cool. I've been thinking of messing with the dash in node red. I'm betting that maybe @Boredom or @JasonJoel would probably be able to give you some input on this. I'm in the middle of a project at the moment, but plan on diving in to a dashboard, so I'll be following.

1 Like

Ultimately, it's of little use for me due to limitations of the formatting, but utility pages like batteries and inactive devices is useful!

I believe you can get as crazy as you want with it using the template node, but I'm not sure that I want to fall that far into the rabbit hole! (I said that about the batteries and inactive devices though soooo....)

Doing something with template node may be the only option. Maybe ui_control....

I've never done dynamic resizing on a dashboard element, though.

Ok thanks! If I find a solution, I'll post it here.

I haven't worked with Node Red yet. Is that inside a div or a span and can you access the CSS? If so then you should be able to set overflow to hidden.

I'm using one of the out of the box text nodes. I could probably do it if I edited the actual nodejs code behind the scenes, but that would make maintenance a pain. If I feel really strongly about it, I'll probably end up using the template node as @JasonJoel suggested.

It really only manifests when I have more than 2 or 3 inactive devices so I probably won't even bother. If I have more inactive devices than that, I probably have bigger problems than a formatting issue. :slight_smile:

There are dashboard nodes that automatically create scrollbars when there are more rows than visible. Might work in this scenario.

node-red-node-ui-table comes to mind

1 Like

Hmm... then I don't even need the code block for formatting the array items into text...

Just full of good ideas! Thanks!

This'll suffice for my needs so have a Solution Check on me!

1 Like

I'd like to see the "after" screenshot. :grin:

2 Likes

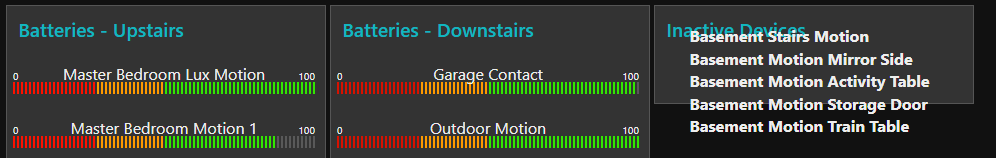
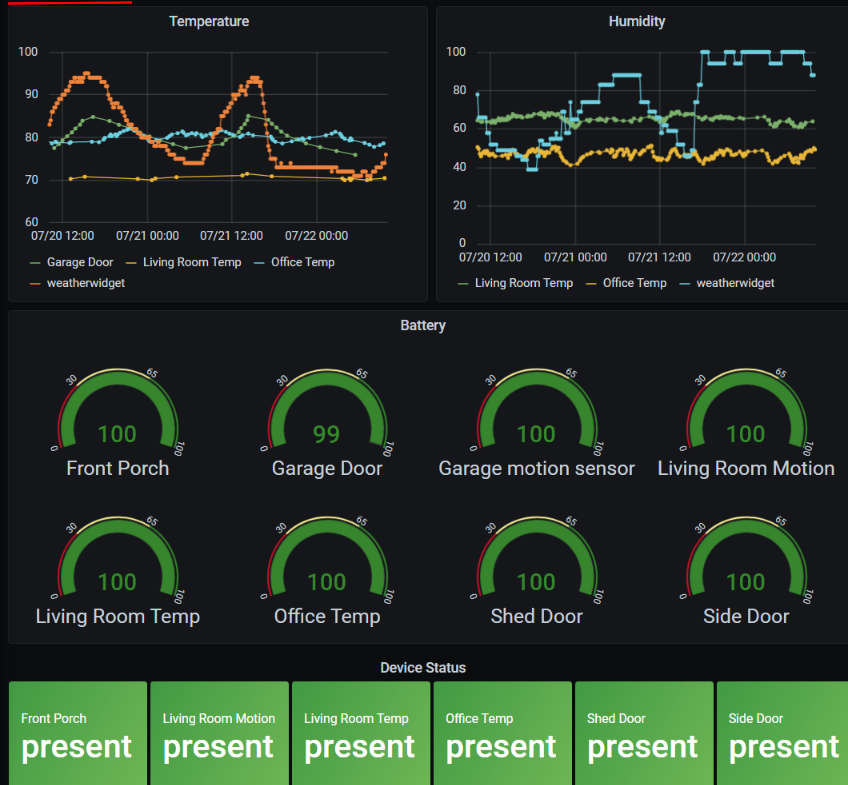
So it was an eenzy bit more work than I had planned on, but here's the "final" result. More formatting to come, but this'll work for now.

Summary

[{"id":"b952c2b8.dacf3","type":"function","z":"93ef70a9.88e32","name":"Populate Inactive Devices","func":"var tArray = global.get(\"inactiveDevices\");\nvar obj = {\"Device\":\"\"};\nvar tTableArray = [];\nif (msg.payload == \"inactive\") {\n let pos = tArray.indexOf(msg.topic);\n if (pos == -1) {\n let newLength = tArray.push(msg.topic);\n }\n}\n\nif (msg.payload == \"active\") {\n let pos = tArray.indexOf(msg.topic);\n if (pos >= 0) {\n let removedValue = tArray.splice(pos,1);\n }\n}\nglobal.set(\"inactiveDevices\",tArray)\nmsg.payload = \"\";\ntArray.forEach(function(item, index, array) {\n obj = {\"Device\":\"\"};\n obj.Device = item;\n tTableArray.push(obj);\n})\nmsg.payload = tTableArray\nreturn msg;","outputs":1,"noerr":0,"initialize":"","finalize":"","x":350,"y":2460,"wires":[["66d9c6bd.881c78","1bf2c70.f302239"]]},{"id":"1bf2c70.f302239","type":"change","z":"93ef70a9.88e32","name":"","rules":[{"t":"set","p":"ui_control","pt":"msg","to":"{\"tabulator\":{\"columns\":[{\"title\":\"Device\",\"field\":\"Device\"}]}}","tot":"json"}],"action":"","property":"","from":"","to":"","reg":false,"x":590,"y":2440,"wires":[["feae0c03.ec7da"]]},{"id":"feae0c03.ec7da","type":"ui_table","z":"93ef70a9.88e32","group":"b86a1d23.87b64","name":"Device Table","order":2,"width":"6","height":"4","columns":[],"outputs":0,"cts":false,"x":770,"y":2440,"wires":[]},{"id":"451be8fa.e77018","type":"hubitat device","z":"93ef70a9.88e32","name":"Basement Motion Mirror Side","server":"2c08a6b7.b90c4a","deviceId":"1296","attribute":"","sendEvent":true,"x":220,"y":2720,"wires":[["dff78774.8678e8"]]},{"id":"dff78774.8678e8","type":"trigger","z":"93ef70a9.88e32","name":"","op1":"active","op2":"inactive","op1type":"str","op2type":"str","duration":"12","extend":true,"units":"hr","reset":"","bytopic":"all","topic":"topic","outputs":1,"x":190,"y":2540,"wires":[["b952c2b8.dacf3"]]},{"id":"b86a1d23.87b64","type":"ui_group","z":"","name":"Inactive Devices","tab":"46970cd.8c1bbf4","order":3,"disp":true,"width":"6","collapse":false},{"id":"2c08a6b7.b90c4a","type":"hubitat config","z":"","name":"Hubitat","usetls":false,"host":"10.10.10.24","port":"80","appId":"32","nodeRedServer":"http://10.10.10.228:1880","webhookPath":"/hubitat/webhook","autoRefresh":true,"useWebsocket":false},{"id":"46970cd.8c1bbf4","type":"ui_tab","z":"","name":"Utility","icon":"dashboard","disabled":false,"hidden":false}]

5 Likes

Ah, much nicer. :+1:

That looks good. Are you monitoring all your devices, and if so, do you have every device listed with it's separate trigger before the change node? I've got something similar, but I use the Hubitat app Device Watchdog and send the data to a table. It's not as pretty and it only runs once a day, so I may move it to this.

No, at the moment, I'm not monitoring all my devices. Only the ones that are capable of monitoring environmental attributes like temperature or lux (thus generating messages without manual intervention) as I am not actively polling them. I just did a quick test to see if anything is generated by webhook when forcing a refresh on a z-wave plus switch and nothing was so I'm not even sure if active polling is an option.

You never know though, there may be a solution out there. Just gotta keep digging!

1 Like

Well, you could always do a periodic devices/* maker api url call, and parse that out. That returns all current values on all devices. NOTE: Use /devices/* not /devices/all - two different code paths... "*" is 3-4x faster than /all, and /all has multiple json formatting issues/returns unusable data in multiple cases.

HOWEVER, doing /devices/* (or devices/all) really clobbers the hub (as it is pulling every command/attribute/value for every device). So might not be the best thing to do except when initializing things after a restart.

Could also do a maker api /devices/[deviceid] call for individual devices.

Typically when I'm populating large tables/lists I do a "/devices/*" on restart/initialization, and then update the table based on update events after that.

As far as I know, that would only give me current state though and not whether it's actively responding to commands. Hubitat could report the state it THINKS a Z-Wave switch is on, but in reality, that switch is borked.

Plus, I've really been trying to avoid clobbering my hub and limit that to when I have to restart node-red... I'm not at the high end of the device count compared to some in the forum, but at 156 devices, I don't relish the thought of a complete attribute pull down.

True / fair point. I can't remember offhand if it also reports last activity time as well (not in front of that system right now) to use for inactivity reporting.

It is always interesting to see different ways of attacking same problem.

here's my dashboard for mostly the same thing

2 Likes

Nice! I do like those guages, but with the number of batteries I have to monitor, they just wouldn't fit... :stuck_out_tongue:

Same for the device presence. A dynamic table works much better for me. That said, your dashboard is soooo much prettier than mine!

ARGHHH... I think I'll be converting my battery status to dynamic table now as well. Stupid rabbit hole!!!

yeah when I get more devices I will be looking at a version of your solution :slight_smile:

I must admit I was blown away by how easy it was to get the HE->NodeRed->infludb->grafana up and working. Really powerful stuff.

I think my next step may be to modify @aaiyar Internet speed monitoring flow to push the data into Influxdb

2 Likes