I've been looking for ways to utilize some of that resource headroom on my node-red box... Influxdb... I like graphs.
The only thing annoying with ui-table is that it doesn't sort by column when dynamically adding rows (at least not without doing some external code/template work).
But that is a minor annoyance to me. I can click the column headers to sort.
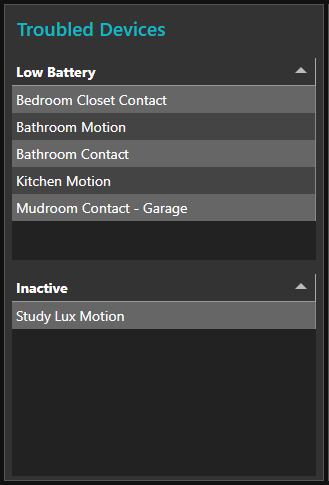
True, but if I have so many 'troubled' devices that I have to sort them, that's probably the least of my issues.
I was really thinking more when I use ui-table for lists battery %, for instance.
I like ui-table for that as it is easy to populate and very dense to pack a lot of data in a small area.
Ah, good point. I was planning on only showing low batteries.
Ah! makes sense!
As much as I appreciate a good graphic... I much prefer this:
I like it!
You inspired me @pat.richards!!
1 Like
@harold.min oh wow that is AWESOME
I have to up my game 
1 Like
just an FYI
Most panels in Grafana allow you to override the dashboard time range
Stats isn't one of them  (to the best of my knowledge)
1 Like
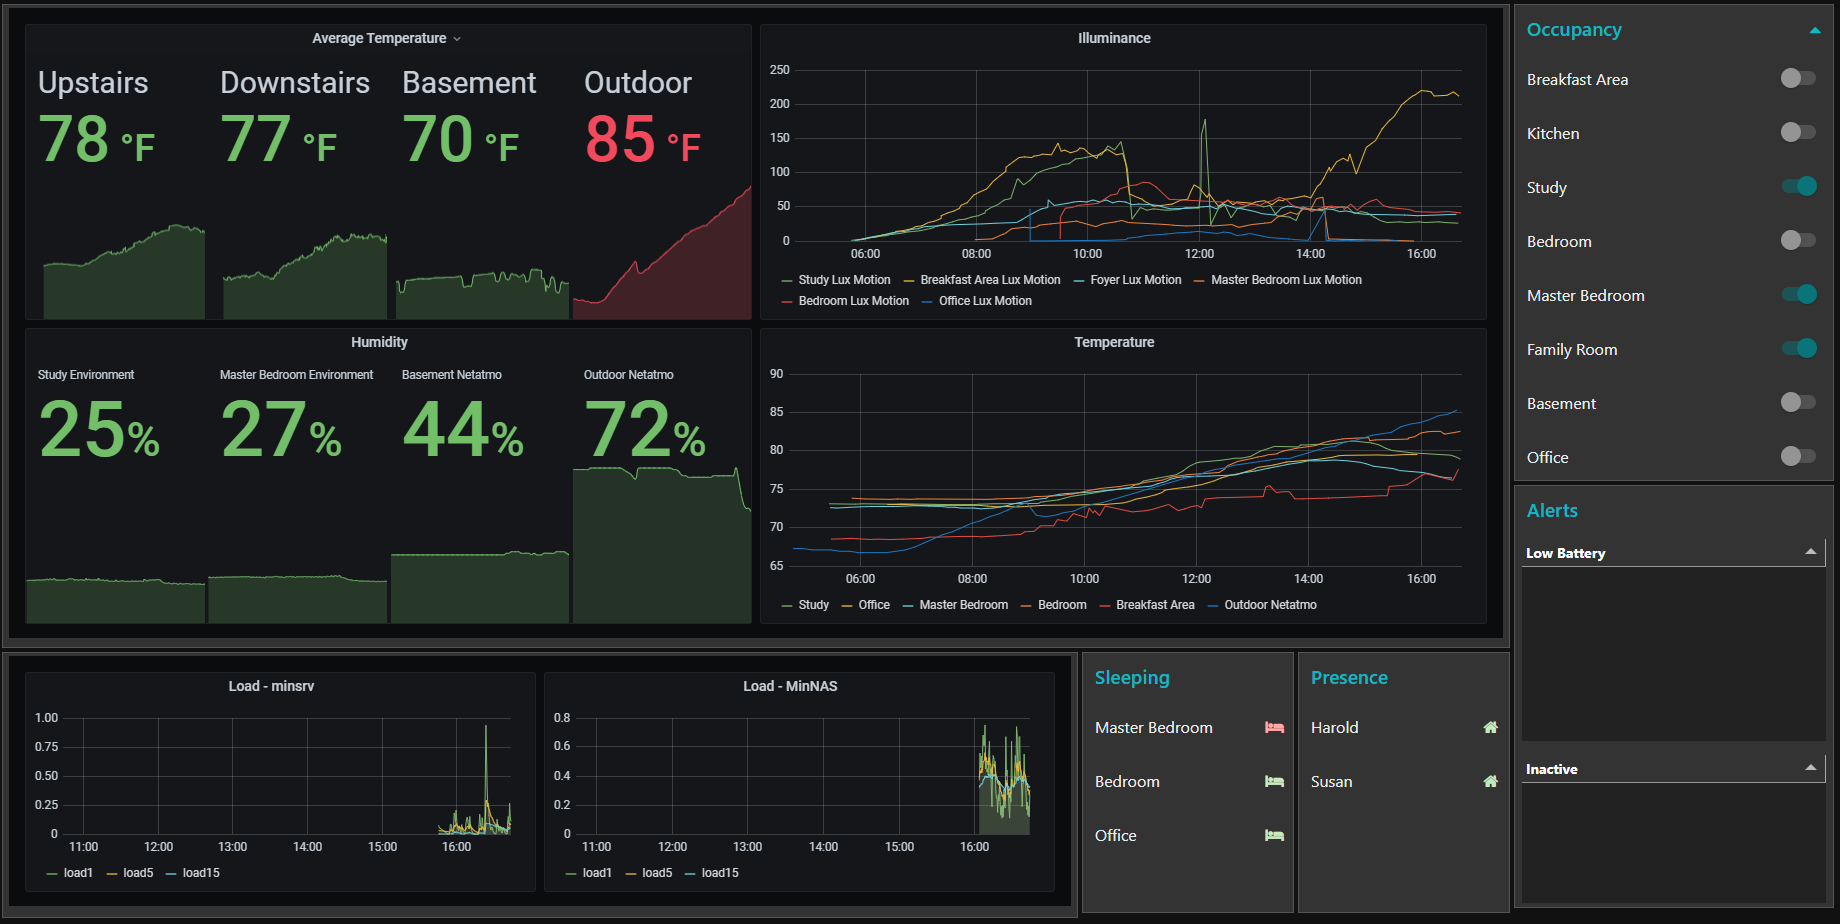
Yeah, I've been playing around with that because we might not leave the house for days at a time these days so our presence doesn't change and I don't really feel like displaying 72 hours of stats... 
my idea was to use my temp graphs for week long view and yours for last 24 and current temp....
I guess could make the default 24 hours and then over ride in the graphs
Like you, my dashboards are constantly getting tweaked as I figure out what information is actually useful and at what interval. Lol, Lux measurements? Do I really need that on my dashboard?
ok latest tweak
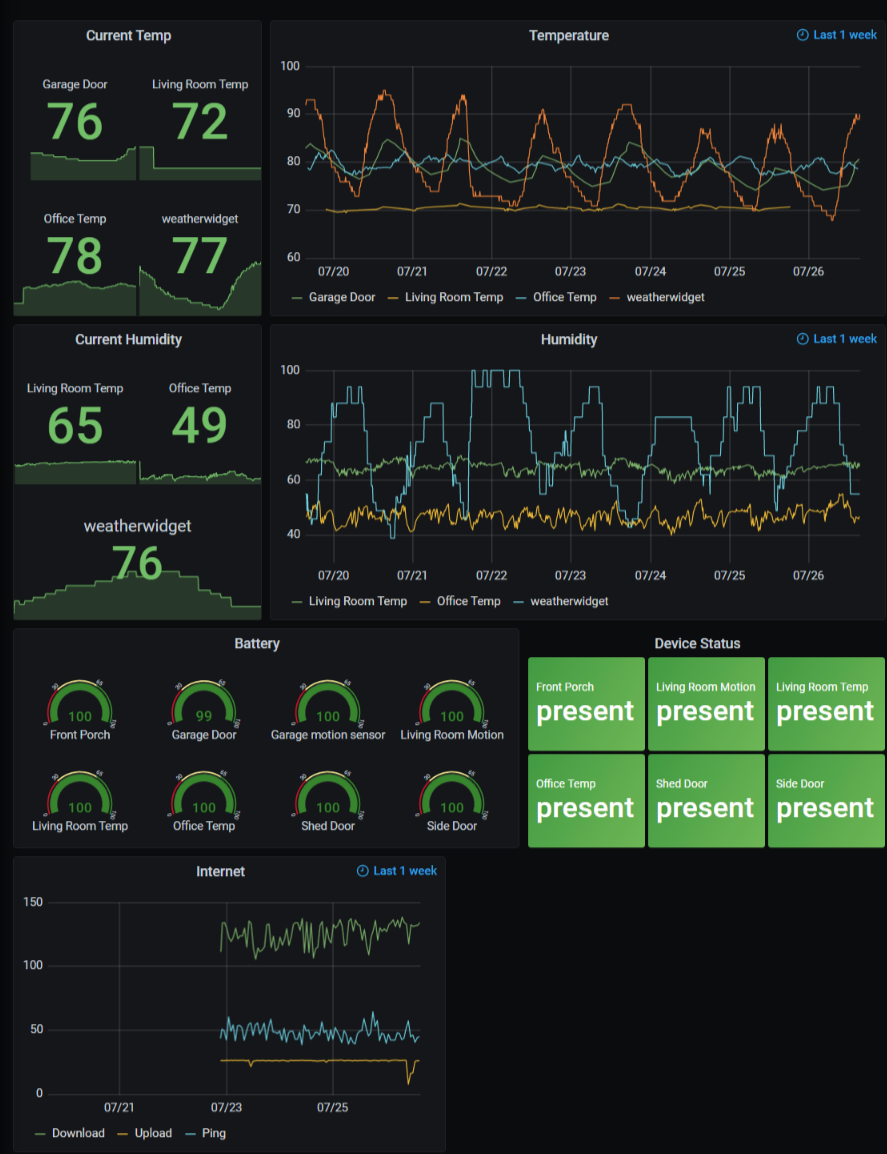
current temp/humidity shows last 24h in graph, next to them is a week long view of same data
2 Likes
Lookin' good! 

I went with the dual Y axes
2 Likes
Looking great guys!
Need to come to the mountain for some help... I have multiple C7 hubs and Node-Red on rPI for Automations. My goal was to only have devices and minimal apps on the Hubs. One hub does use hub connect to receive device status with a SmartThings hub. I am now at a point where I feel comfortable that my environment is stable (sort of) and I want to start a few dashboards. Should I be using HE dashboards which means I would need to use Hub Mesh to connect all my hubs. Can I get the same dashboards out of Node-Red, is there something else that would make a good dashboard and interface with Node-Red.
I don't have a ton of devices on any of my Hubs, I just had mesh problems and threw hardware at it, so I don't believe any of them are overloaded. The rPI rarely goes to 7% load so it seems like either could handle it, but I would like to avoid an obvious false start... Thanks for any advice.
I use Node Red on a rPi for all my logic and have it connected to 2 Hubitat Hubs (that just run my Zigbee devices at different parts of the house) and other stuff like my Iotawatt and Deconz. I also agonised over where best to have the dashboards.
I ended up using Node Red as all the information was already there - it is like the central switchboard in my system. To use one of the Hubitats I would have to link across to it from the other Hubitat and also from Node Red for some information.
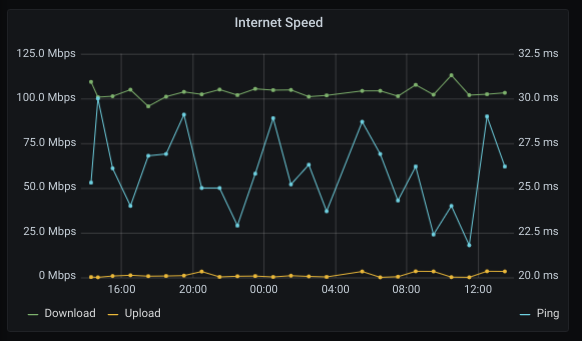
The main drawback (apart from the learning curve) of using Node Red dashboards is the lack of remote access. I ended up using another rPi to run a VPN server to give my phone and tablet access when not at home. It works but I just followed an online guide step by step and haven't really got a clue what's going on there!
The formatting of the Node Red dashboard doesn't scale well though and what looks fine on my tablet looks crazy on my phone. Fortunately I have got to the stage where I only use dashboards to give me information, and rarely need to control anything as it's all pretty much automatic.
This topic was automatically closed 365 days after the last reply. New replies are no longer allowed.

