Ok, do me a favor and follow the following steps for Troubleshooting:
In Hubitat, go open your MakerAPI Instance
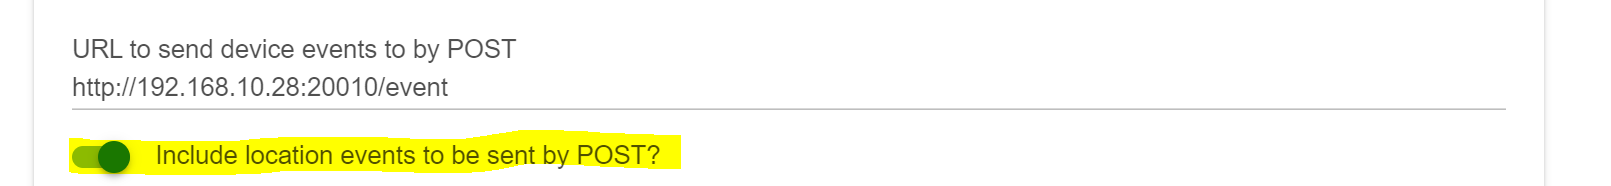
Scroll down to find your "URL to send device events to by POST"
Copy the URL and enter the URL in a new browser window
You will see a view like this, showing you the logging output of the plugin, the ability to download the log-file to your computer, enablign, disabling debug mode and see your current configuration
Click the button "Enable Debug Mode"
Change the mode or HSM status the way it causes you issues
Click the "Download Log File" button
Send me the downloaded file. I'll PM you an email address that you can send it to.
the mode change events don't event arrive at the plugin. Go back into MakerAPI on Hubitat and make sure that the setting "Include location events to be send by POST?" is enabled
@dan.t , is there a more elegant way to reset the being “triggered” in the Home app from a custom HSM alert. I clear them in HE, but the only way to get it cleared in the Home app is by restarting Homebridge, or arming and then disarming the system from Home.
BTW I’m using the HubConnect version.
Clearing the triggered alerts works perfect. I’ve been having issues with changing modes. I can make the first mode change in the Home app without an issue, but if I try to change the mode back, or to anything else it doesn’t work and the mode button goes unresponsive. If I change the mode from dashboard it works as expected and fixes the unresponsive mode buttons in Home. Any idea how I can fix this. I had the same problem with the Makerapi version. This is the only other issue I have had.
I just tried that a million times and can't reproduce that. You are using HubConnect, correct? If so, please follow these steps here:
In a new browser window go to http://HOMEBRIDGE-IP:20009/
20009 is the port the plugin is listening per default. You might have configured a different port in your config.json. If so, please use the port in your config.json
You will see a view like this, showing you the logging output of the plugin, the ability to download the log-file to your computer, enabling, disabling debug mode and see your current configuration
Click the button "Enable Debug Mode"
Do your mode changes flow that cause the issue
Click the "Download Log File" button
Send me the downloaded file. I'll PM you an email address that you can send it to.
Thanks. I appreciate your help. I’ll do this tonight. This is literally the only problem I have ever had with this app (besides the alerts that are fixed now) and had the same issue with the Makerapi version. Could it be because I have 10 modes?
@dan.t, I just switched over from the MakerAPI plugin to the HubConnect plugin using http. All working well with the exception of HSM - the events are seen by the plugin, but seem to be ignored, I.e. the HSM state changes aren’t shown in the Home app.
Here’s a log file snippet:
[11/29/2019, 12:55:13 PM] [Hubitat hhh:0.3.6] New logging client connected
[11/29/2019, 12:55:19 PM] [Hubitat hhh:0.3.6] Debug logging enabled
[11/29/2019, 12:56:04 PM] [Hubitat hhh:0.3.6] Received set HSM State request for state: armAway
[11/29/2019, 12:56:04 PM] [Hubitat hhh:0.3.6] Lets ignore this and use the eventsocket for it...
[11/29/2019, 12:56:07 PM] [Hubitat hhh:0.3.6] send ping
[11/29/2019, 12:56:07 PM] [Hubitat hhh:0.3.6] GET:  { debug: false, path: '/ping', method: 'GET' }
[11/29/2019, 12:56:09 PM] [Hubitat hhh:0.3.6] HE websocket sending keepalive ping
[11/29/2019, 12:56:09 PM] [Hubitat hhh:0.3.6] HE got pong
[11/29/2019, 12:56:34 PM] [Hubitat hhh:0.3.6] Received set HSM State request for state: disarm
[11/29/2019, 12:56:34 PM] [Hubitat hhh:0.3.6] Lets ignore this and use the eventsocket for it...
Also, I originally installed the Hubconnect client using websockets, and noticed the same problem with HSM state changes. I then reconfigured the client to use http. Same result.
In a new browser window go to http://HOMEBRIDGE-IP:20009/
20009 is the port the plugin is listening per default. You might have configured a different port in your config.json. If so, please use the port in your config.json
You will see a view like this, showing you the logging output of the plugin, the ability to download the log-file to your computer, enabling, disabling debug mode and see your current configuration
Click the button "Enable Debug Mode"
Turn a switch on/off and make an HSM change
Click the "Download Log File" button
Send me the downloaded file. I'll PM you an email address that you can send it to.
I see what is going on. It is the ‘ in your mode names. I am going to take a look at it. I didn’t expect that someone would use an apostrophe in a name....


 being “triggered” in the Home app from a custom HSM alert. I clear them in HE, but the only way to get it cleared in the Home app is by restarting Homebridge, or arming and then disarming the system from Home.

