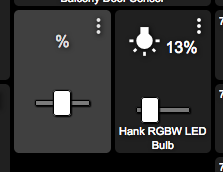
My dashboard shows various devices in the wrong state. When I click a tile to change the state, it just grays out and gets stuck. Automations are running ok, But the device pages for some of my devices also show incorrect state. Refresh and config don't help. Punching buttons on the device page does not add anything to the logs. I rebooted the hub too. That didn't fix anything. Could these devices have fallen off my Z-Wave network or something? How do you know if all your devices are still in contact with the hub? Actually, that can't be it... some of the devices respond to the buttons on their device page, and some (my lock and at least one light) do not.
What kind of devices?
A GE In-wall switch, two GE in-wall Outlets and a Kwikset lock... maybe more... all Z-Wave
Has anybody seen this happen before? I'm sitting in the dark, literally, while I try to figure it out  I just tried replacing the tiles, but that does not help either...
Dashboard 'connects' to the devices you define on each dashboard. (Which reminds me.. don't add a bunch of extras to the list of devices available, Dashboard is going to retrieve them, even if you haven't made a tile for it.)
If you delete a device, it's going to be deleted from the list of devices available to Dashboard and the tile will just go grey:
To have the tile be 'complete' yet not work with it's device... I wonder if the devices are duplicates. Tile is 'pointing' to an orphan/ghost device. You go to the device page and can work it, but that's not the device Dashboard is pointing to.
I am REALLY reaching here.. I can't think of a time when a SWITCH didn't work for me. I've bumbled with dimmers.. it's kinda small square to hit, but a switch, outlet not anything I recognize.
Wrong state, yes, I've seen that. Browser refresh seems to cure that for me.
I've had Motion Sensors show active:
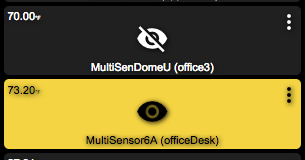
when I know they are not.. and I refresh and it's all good again. I think I could just wait, but yea, that'll happen !! 
Thanks for that tip!
1 Like
Refresh doesn't fix it. Rebooting doesn't fix it. Throwing away tiles and replacing them does not fix it. Two devices don't respond to buttons on their own device pages. Some log button clicks, some do not. Some log the wrong button clicks. When I click "Configure" on the light switch, the log says Refresh is called. When I click Refresh it also says Refresh is called. Is that normal?
I don't know how I could have a duplicate device?
I don't understand your tip about not adding extra devices? Each device I have paired has added itself to the drop down list of potential tiles. I haven't added anything to that list manually, and I wouldn't know how...
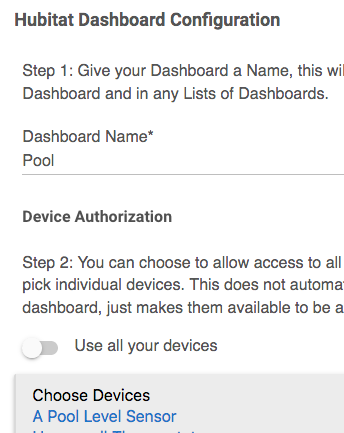
I'm referring to that list... Keep It Simple. Put into that list only what you're going to display on that specific dashboard.
This has nothing to do with your current issue.. but something caused me to remember....
You could have 4 dashboards and 'everything" in the list for each. Then use 15% on each Dashboard. As you switch Dashboard to Dashboard, it would be slower, due to getting the status of 'everything' before it can begin displaying.
So go ahead, add what you need or even what you might need, then when it's pretty much done, take the step of trimming the list of the ones that aren't actually in use on that specific Dashboard.
Have you started a Support@Hubitat.com Ticket?
I think maybe @bobbyD may want to look at your hub and see if there's a corruption.
See. I only have one dashboard, and all my devices are on it...
But it might be overlapping problems. Devices that don't respond to their own device page are probably not going to wok in the dashboard either. I'm realizing.
Ah, no I haven't started a ticket. I didn't know that was an option Thanks!
Actually, before I do that, is there a way to "Rebuild Z-Wave Network" like we had in IRIS? These are all Z-Wave devices
Of course...
Start a live log.. Right click on Logs on the left: open in new tab.
Back on your other tab, Settings:Zwave Details: Zwave Repair button up at the top
On the live logging page, you'll see Hub there at the top, click on it and you can watch just the repair.
If you refresh or leave the live log page, it starts again at empty. You can click on items in/on the live log panel, like Hub or All.
Well, that was a disaster. I did a Z-Wave repair. Devices still not responding, and now my dashboard looks like this:
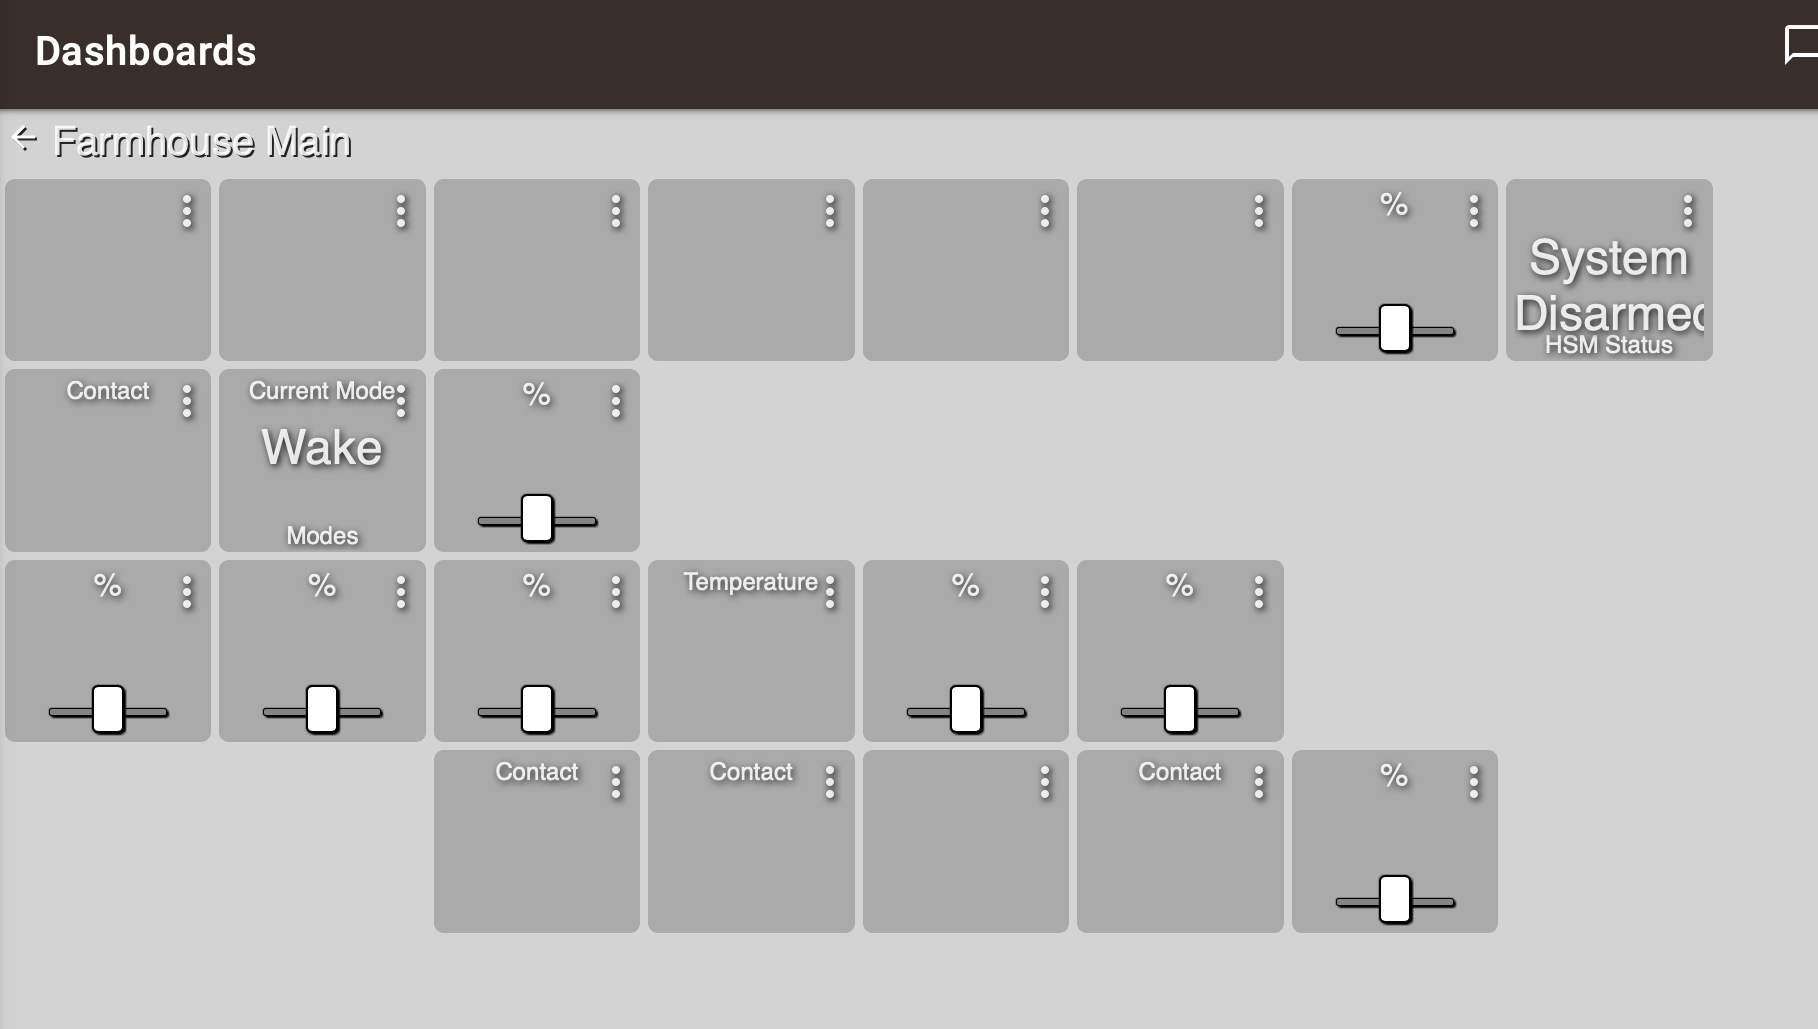
Totally blank... I guess I'll use that support link now!
This means the state of the devices is not known. Unfortunately, dashboard isn't really the issue here, its between the device and hub. The hub doesn't know the state. Try clicking the refresh button in one of the missing devices and see if it has states (right side of the web interface for that device).
Dashboard is merely a reflection of the device you selected state for that tile.
Yes, it has states and they are wrong.
Well, let me expand on that. The devices that were never responding still do not respond and clicking buttons on their device page does nothing. The states shown are wrong.
The devices that were responding to various degrees show partially correct states. If I turn off a switch the state correctly changes to off, but other things like power consumption do not change.
So the question is, what's going on with the Z-Wave repair? Did it throw any errors in the logging?
If you click configure or refresh does it update the states for the device?
Have you added, changed, removed any repeaters (powered z-wave devices) that might have lost the connection between the devices and the mesh?
Keep live logging open and see if any errors or anything of importance shows up during or after a Z-Wave repair or when clicking refresh or configure in each device.
sys:12019-02-22 02:18:38.543 pm infoFinished Z-Wave Network Repair
sys:12019-02-22 02:18:25.265 pm traceZ-Wave Node 9: Repair is done.
sys:12019-02-22 02:18:25.248 pm traceZ-Wave Node 9: Repair is requesting node neighbor info
sys:12019-02-22 02:18:25.245 pm traceZ-Wave Node 9: Repair is adding return route
sys:12019-02-22 02:18:25.220 pm traceZ-Wave Node 9: Repair is deleting routes
sys:12019-02-22 02:18:25.158 pm traceZ-Wave Node 9: Repair is requesting device associations
sys:12019-02-22 02:18:17.346 pm traceZ-Wave Node 9: Repair is updating neighbors
sys:12019-02-22 02:18:09.504 pm traceZ-Wave Node 9: Repair is updating neighbors
sys:12019-02-22 02:18:01.708 pm traceZ-Wave Node 9: Repair is updating neighbors
sys:12019-02-22 02:17:53.925 pm traceZ-Wave Node 9: Repair is updating neighbors
sys:12019-02-22 02:17:53.556 pm traceZ-Wave Node 9: Repair setting SUC route
sys:12019-02-22 02:17:53.535 pm traceZ-Wave Node 9: Repair pinging
sys:12019-02-22 02:17:53.532 pm traceZ-Wave Node 9: Repair starting
sys:12019-02-22 02:16:20.111 pm traceZ-Wave Node 5: Repair setting SUC route
sys:12019-02-22 02:16:18.516 pm traceZ-Wave Node 5: Repair setting SUC route
sys:12019-02-22 02:16:16.937 pm traceZ-Wave Node 5: Repair setting SUC route
sys:12019-02-22 02:16:13.966 pm traceZ-Wave Node 5: Repair setting SUC route
sys:12019-02-22 02:16:08.524 pm traceZ-Wave Node 5: Repair pinging
sys:12019-02-22 02:16:08.521 pm traceZ-Wave Node 5: Repair starting
sys:12019-02-22 02:14:35.363 pm traceZ-Wave Node 4: Repair setting SUC route
sys:12019-02-22 02:14:33.817 pm traceZ-Wave Node 4: Repair setting SUC route
sys:12019-02-22 02:14:32.169 pm traceZ-Wave Node 4: Repair setting SUC route
sys:12019-02-22 02:14:28.947 pm traceZ-Wave Node 4: Repair setting SUC route
sys:12019-02-22 02:14:23.513 pm traceZ-Wave Node 4: Repair pinging
sys:12019-02-22 02:14:23.509 pm traceZ-Wave Node 4: Repair starting
sys:12019-02-22 02:12:49.573 pm traceZ-Wave Node 3: Repair setting SUC route
sys:12019-02-22 02:12:49.054 pm traceZ-Wave Node 3: Repair setting SUC route
sys:12019-02-22 02:12:48.568 pm traceZ-Wave Node 3: Repair setting SUC route
sys:12019-02-22 02:12:47.994 pm traceZ-Wave Node 3: Repair setting SUC route
sys:12019-02-22 02:12:43.498 pm traceZ-Wave Node 3: Repair pinging
sys:12019-02-22 02:12:43.495 pm traceZ-Wave Node 3: Repair starting
sys:12019-02-22 02:11:08.450 pm traceZ-Wave Node 2: Repair setting SUC route
sys:12019-02-22 02:11:07.260 pm traceZ-Wave Node 2: Repair setting SUC route
sys:12019-02-22 02:11:06.060 pm traceZ-Wave Node 2: Repair setting SUC route
sys:12019-02-22 02:11:03.745 pm traceZ-Wave Node 2: Repair setting SUC route
sys:12019-02-22 02:10:58.448 pm traceZ-Wave Node 2: Repair pinging
sys:12019-02-22 02:10:58.438 pm traceZ-Wave Node 2: Repair starting
sys:12019-02-22 02:10:58.354 pm infoStarting Z-Wave Network Repair
I don't know what it should look like. Is this normal?
I removed one device that paired itself but does not have a driver, so it was not working. But this did not happen at the same time as that removal... this problem started somewhat later.
And no, configure and refresh do nothing.
How many Z-Wave devices do you have? The Repair is only seeing 5 repeaters during that last repair.
Seven
Numbered 02, 03, 04, 05... then a gap.... 08, 09, 0A
I still have my IRIS system running... because I haven't figured out how to do security with Hubitat yet... but I've taken so many Z-Wave devices off the IRS network that it's starting to fail. Maybe that is interfering? I wonder if I need to re-build that network?
UPDATE: I tried rebuilding my Iris Z-Wave network and it failed to find any of the Z-Wave devices that have dropped off it's own network. I guess I should have remembered to rebuild that each time I removed something and re-paired it to Hubitat. So, that might be a warning to others who are doing a slow-mo transition. My Iris system is now crippled and I have no security system now.  But worse than that... none of my devices are in the dashboard drop down list. None of the Z-Wave OR Zigbee! All MIA.

