So, I had my system which hosts Uptime Kuma go partially down the other day, one of which services was Uptime Kuma itself. So obviously I had no idea what else was not working until I found out the hard way. Decided I should setup a redundant check to monitor Uptime Kuma and what better place than Hubitat since I have easy access to send notifications.
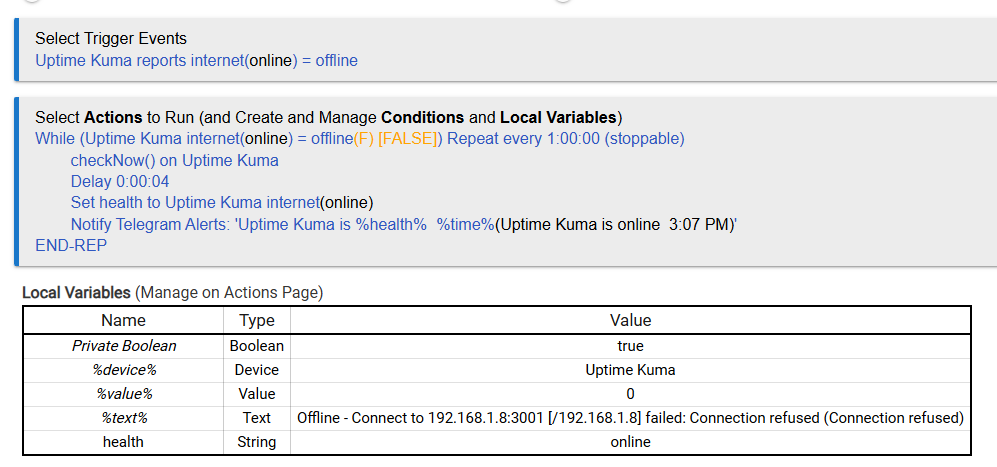
If the state gets changed to online with the checkNow() called in the loop, using the variable for the state gets the current state so it will report online then end. Not a guarantee to get the final online notification however, just depends on the order things happen in. I didn't want to make this even more complicated so called this good enough.
You could also use the %text% in the notification if you want all that info in there.
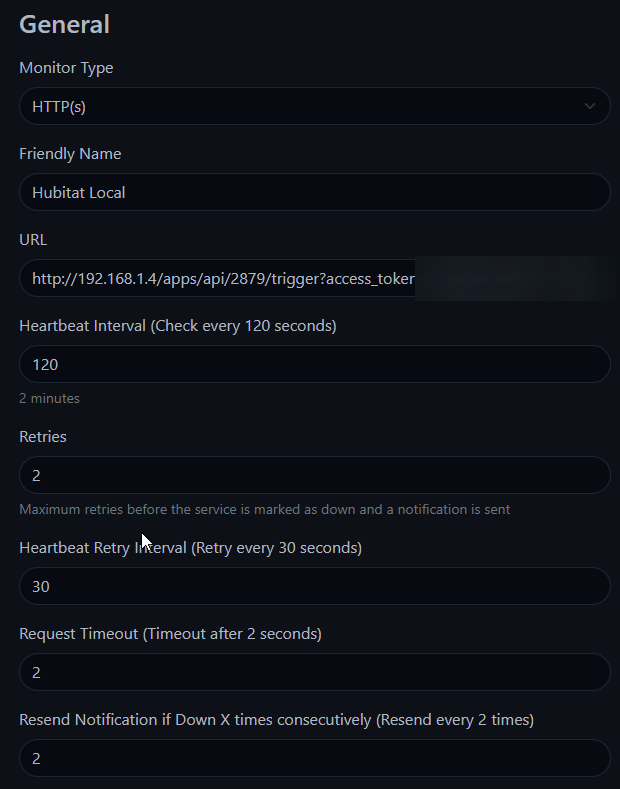
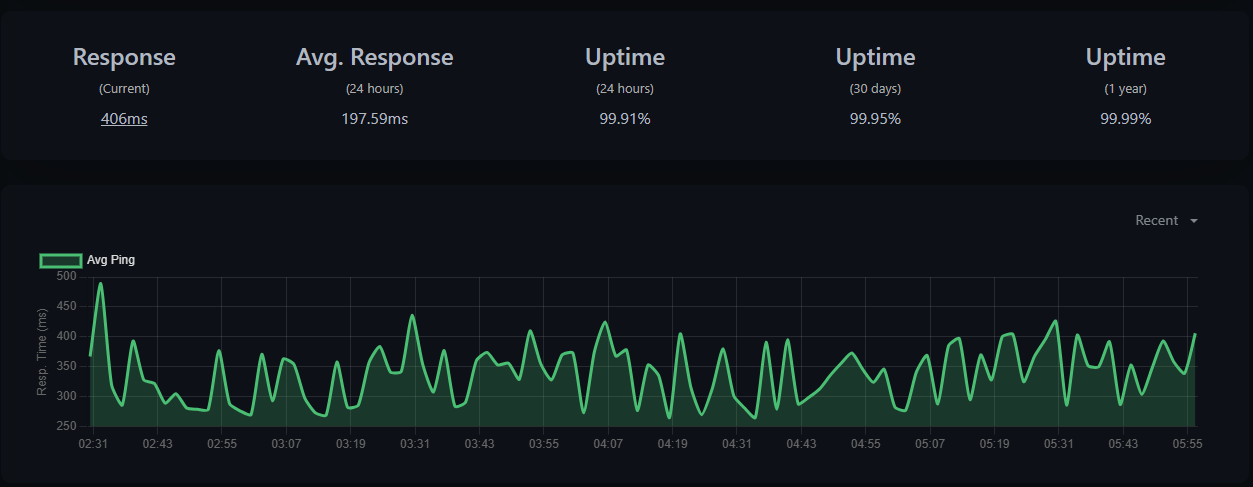
A regular http monitor pointed at the Hubitat local endpoint that triggers the rule. In this example I set it to run every 300 seconds (5 minutes) and notify after 2 failures
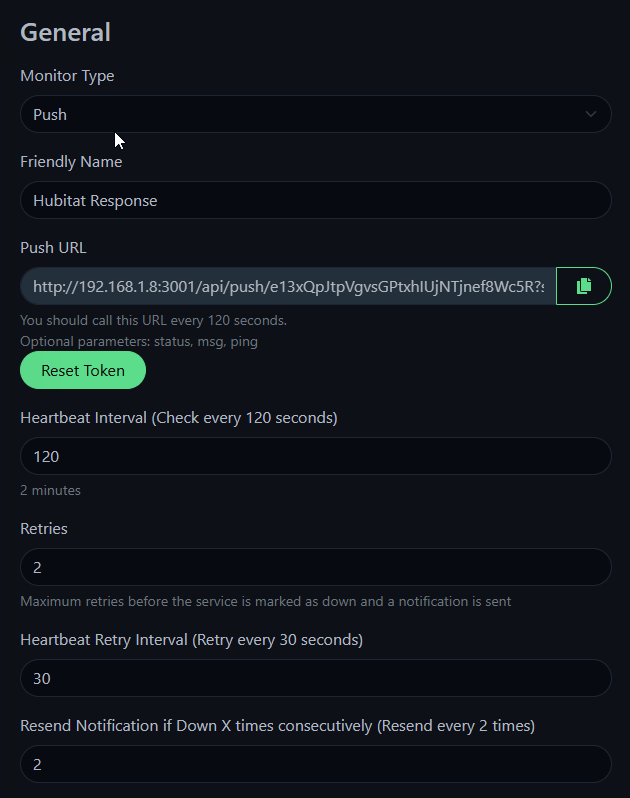
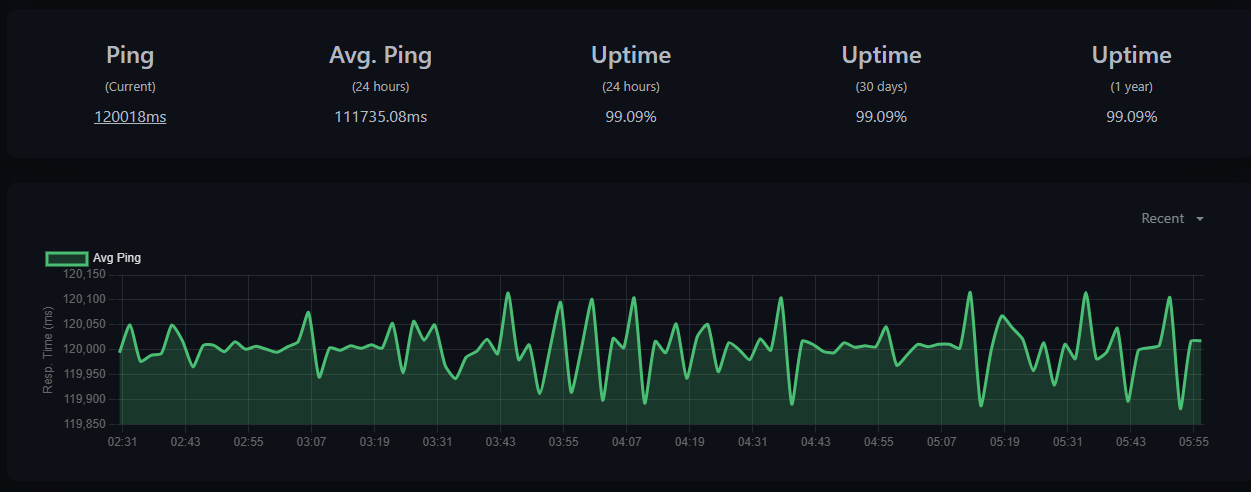
A push monitor. The URL for the push monitor is called by the Hubitat rule. It is set to expect a call every 360 seconds and notify after 2 failures.
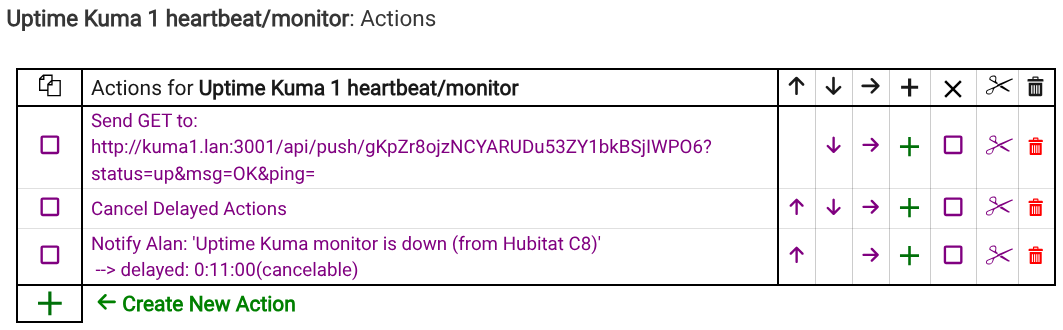
So, every 5 minutes, the UK http monitor calls the Hubitat. The Hubitat calls back to Uptime Kuma push monitor and sets a cancelable delayed notification that will send if there isn't another inbound call within 11 minutes.
If Uptime Kuma stops calling, the Hubitat sends its notification (this could be looped for repeated notifications if needed).
If Hubitat stops responding on the endpoint, the Kuma http monitor will alert on its next call.
If Hubitat stops processing rules, the Kuma push monitor will alert.
The alerts on the http monitor could be disabled to avoid double notifications from UK, and obviously times can be shortened for faster alerts or extended to avoid false alerts during device reboots.
This doesn't just monitor ping response, but ensures that automations / actions are actually running on both ends.
I like that approach, I was actually thinking of doing something like that when I was revisiting my setup afterwards. Your rule is clean and simple. I also realized the push monitor in UK does not give any sort of ping, so you just know up or down not any response time or lag.
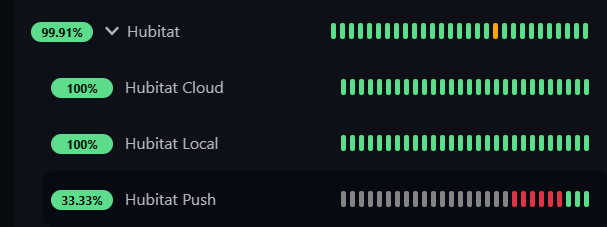
Cloud hits a cloud endpoint I setup in RM, to check for cloud connection.
Local hits the Web UI HTTP (via IP) to check if hub is functional.
Push I just added, explained above.
I could probably just replace the HTTP monitor with a rule trigger like you have setup. If the UI on port 80 is down I don't think the rule trigger would be able to work either. Then I could get rid of that extra virtual device I added for the HTTP monitor.
Also would like a way to track the response times of Zwave devices for any lag developing, that has been my only other issue recently. I think it finally quit acting up though, has been solid this week.
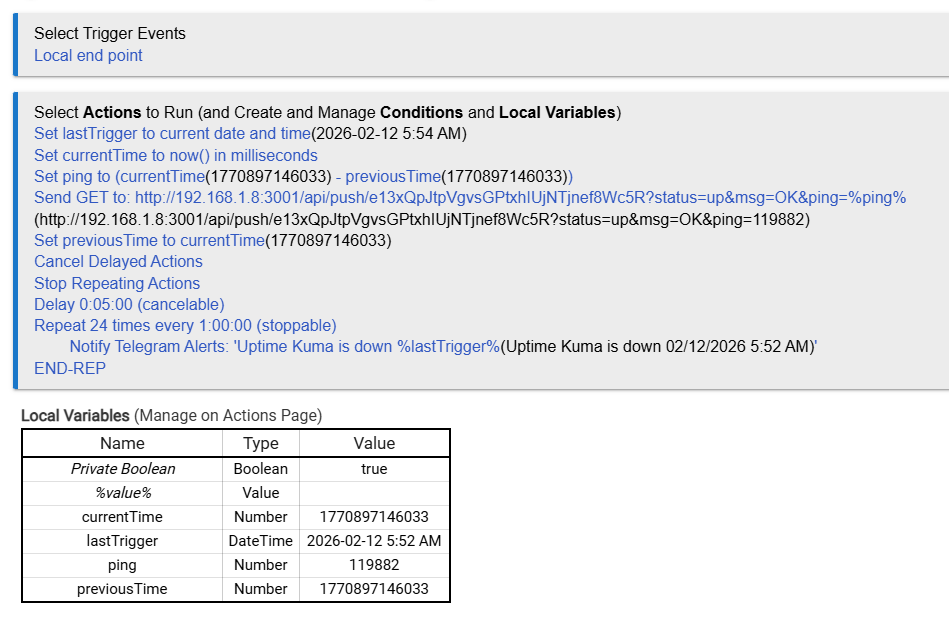
Ok, my slightly more complicated spin on your rule. I really wanted to send some sort of "ping" in the push monitor so I did a time diff between runs. Also added a repeating notification. My interval in UK is 120s, 2x is 4 minutes, hence the delay on the notification is 5 minutes.
This eliminated the virtual device driver to monitor UK, everything is done in the rule.
Also hitting the rule endpoint seems to give a better idea of hub response time than just checking the Web UI.
What exactly do you mean by partly go down? What hardware were you using to run Uptime Kuma? If it is a server, can't you configure alerts within its idrac/ilo?
I let the disk space run out on accident and a bunch of stuff went sideways or crashed. Its all running on a Debian VM, on an old mini-PC. It started out with just Homebridge, and has grown a lot. Need to move it all to a new better machine eventually, without the VM setup.