Mind sharing the flow?
Change URL to your hub IP.
Side note, the flow below does not do this, but you can use a save chart subflow as well to make the graphs persist reboots. There are a few threads out there on how to make node-red dashboard charts persist reboots.
2 Likes
I have been trying to figure out how to do this off & on for last 2 days and was about to create a thread asking how to do this? Does msg.payload[-1] take the last line in an array?
Thank you for being psychic.
It takes the last element in the payload array (if payload is an array, of course). In this case I put each line into an array element, so [-1] worked great to get the "current"/newest value.
I finally figured out how to get the raw data into an array with the CSV node last night but couldn't figure out how to reference just the last one. Thank you. That Change Node was the missing piece to my flow.
1 Like
I have a similar problem with my C7 since the last firmware.
After it froze a few day ago with a bunch of error like these:

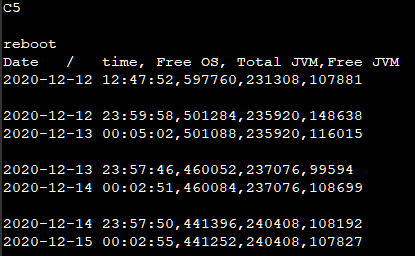
I started to check my memory history: (I pulled out sample every 12 hours to spare you a long list of number)
2020-12-11 21:03:55,563020,250000,156167
2020-12-12 09:00:30,500156,250000,121311
2020-12-12 21:02:12,459540,250000,146752
2020-12-13 09:04:22,433904,250000,142267
2020-12-13 21:01:56,404952,250176,149084
2020-12-14 09:04:11,389504,251764,138037
2020-12-14 21:02:13,375388,253668,135064
It shows a definite leak. I tried figuring out what would cause it by desabling devices and app but could not pinpoint the problem.
At this rate I will run out of memory again in a few days. It was working fine before the update. Since there was a bunch of updates in a row that made the system reboot, I can't be sure if it's realy the last update that did it.
I don't know what I can do to figure it out.
I believe so. I'll ping your hub every now and then to get some statistics, like memory use, if you don't mind.
It does a lot more when Groovy is around, at a cost.
1 Like
@gopher.ny seems like the work you did on .158 slowed the memory leak on C3 but increased it on C5. I see same leak pace as @mykesx posted. I have very few devices on my C5 and do nothing with it by comparison to what I see others doing.
I've still got a couple of the Iris 3210's paired as zwave repeaters and several Monoprice 15654s that run using a Zooz driver done by @krlaframboise.
Also I have a couple of the Zooz 4-1 sensors running on the C5 hub but from what I've read they are not an issue on the C5.
I run the HubConnect app on my C3 and C5 hubs that does generate some traffic.
Edit, I keep the 3210s and those Monoprice devices around for power reporting. All of those little power reporting bits do generate a lot of traffic. At this point I've tried turning most of that traffic off to see if that is the issue but so far reducing that traffic has made no difference.
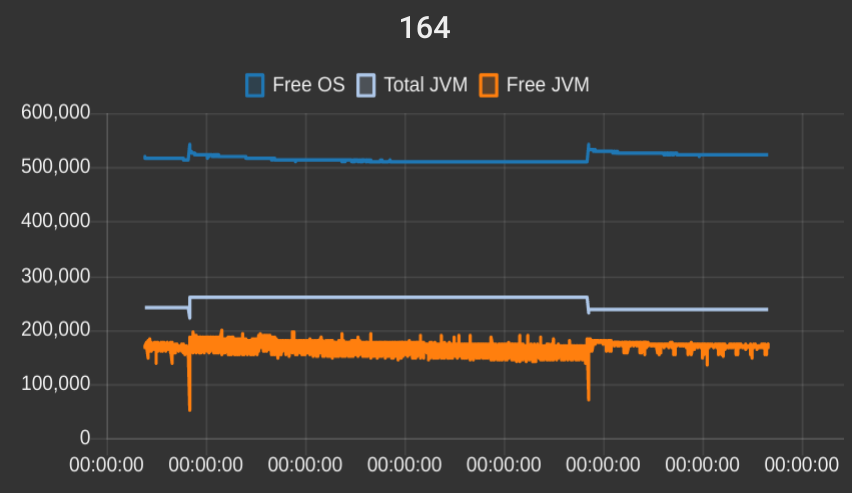
Here is the memory graph for my C-5. Based on that, it doesn't seem like there is a memory leak at the platform level (at least not a huge one). Maybe the Free JVM is slowly going down, hard to tell, really. Note each vertical section is 2 days, so that is ~4 days uptime since last reboot on the right, and the chunk in the middle is about 8 days.
That said, this hub is lightly loaded so there could be interactions between certain apps/drivers that leak memory though that I'm not seeing. Or maybe it is transaction count based, so it would take a lot more time to see on lightly loaded hubs?
Not even sure at what I'm looking at but maybe someone smarter than me can glean something from this glimpse.
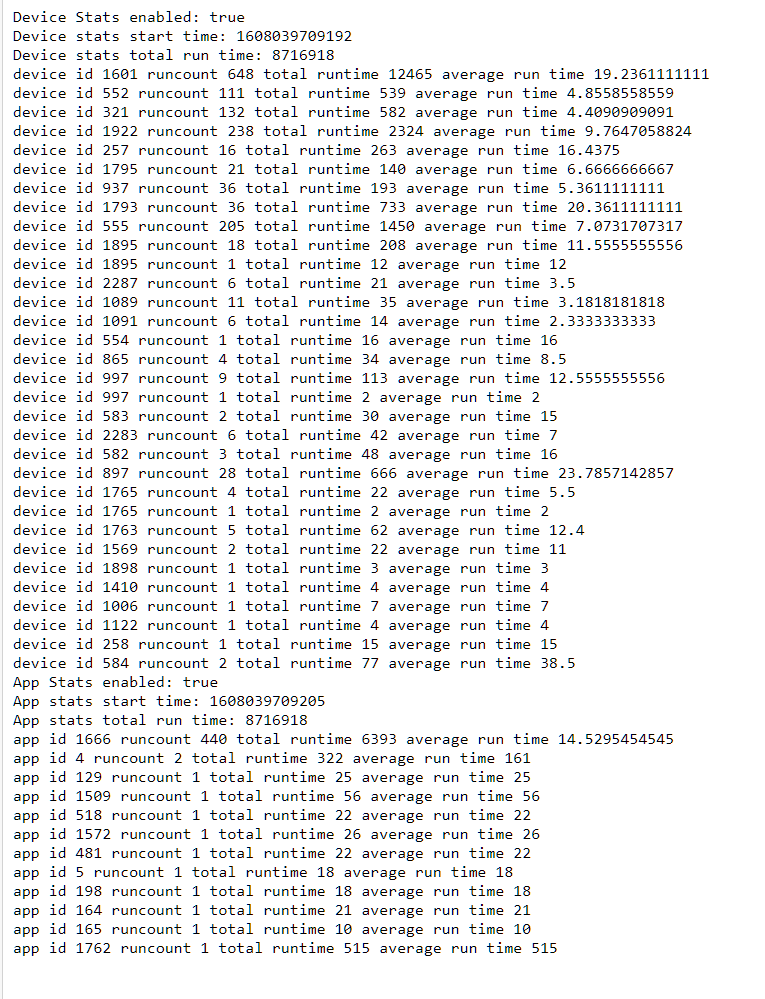
@mpoole32 The memory looks fine on yours given the limited amount of memory history hard to be sure though.
Device 1601 is talking a lot. That may or may not be normal but something to look into. Reducing how many times this device triggers could help some. The execution time on all the devices look good.
App 1666 has a high runcount but the average run time is low so not as impactful. Reducing the times this app runs could help some.
These links will take you to the device and app respectively.
http://hubitat.local/device/edit/1601
http://hubitat.local/installedapp/configure/1666
@lewis.heidrick Device 1601 is one of those monoprice\zooz like smart plugs that reports power. I had it set to be somewhat chatty for this test. App 1666 is the client side of Hubconnect.
Is it worth watching these numbers or easier to just plan a reboot every few days? Thanks for the feedback.
For your instance I'd suggest removing the 3210's on the zwave side. You can keep them on the zigbee side. Also lower the power reporting to only what is necessary.
1 Like
A heads up. I didn’t disableStats (see the enableStats URL earlier in the thread). The hub was really slow while stats enabled. A noticeable lag between tapping on the buttons in the hubitat UI and the device changing state.
Probably obvious to many of you, but maybe this helps someone.
1 Like
I'll be sure to include a note with more obvious implications if it's left running next time.
2 Likes
Version 2.2.4.158 seems to be a bit better.
I am coming into this late and wanted chime in on this possible memory leak. This is a month worth of data showing memory decreasing over time. My hub IS NOT slowing down but not sure if I am looking at a problem in the near future. I have noticed memory drops that don't recover when I am updating apps, be it through Package Manager, or directly through GITHub.
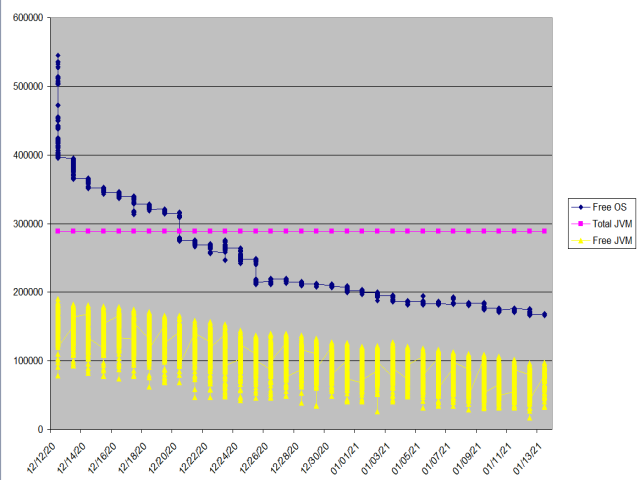
1 Like
AFAIK Z-Wave associations do the same - direct device to multiple devices messaging, w/out routing message through controller.
Unfortunately not all Home Automation software supporting / care about that staff in Z-Wave device drivers.
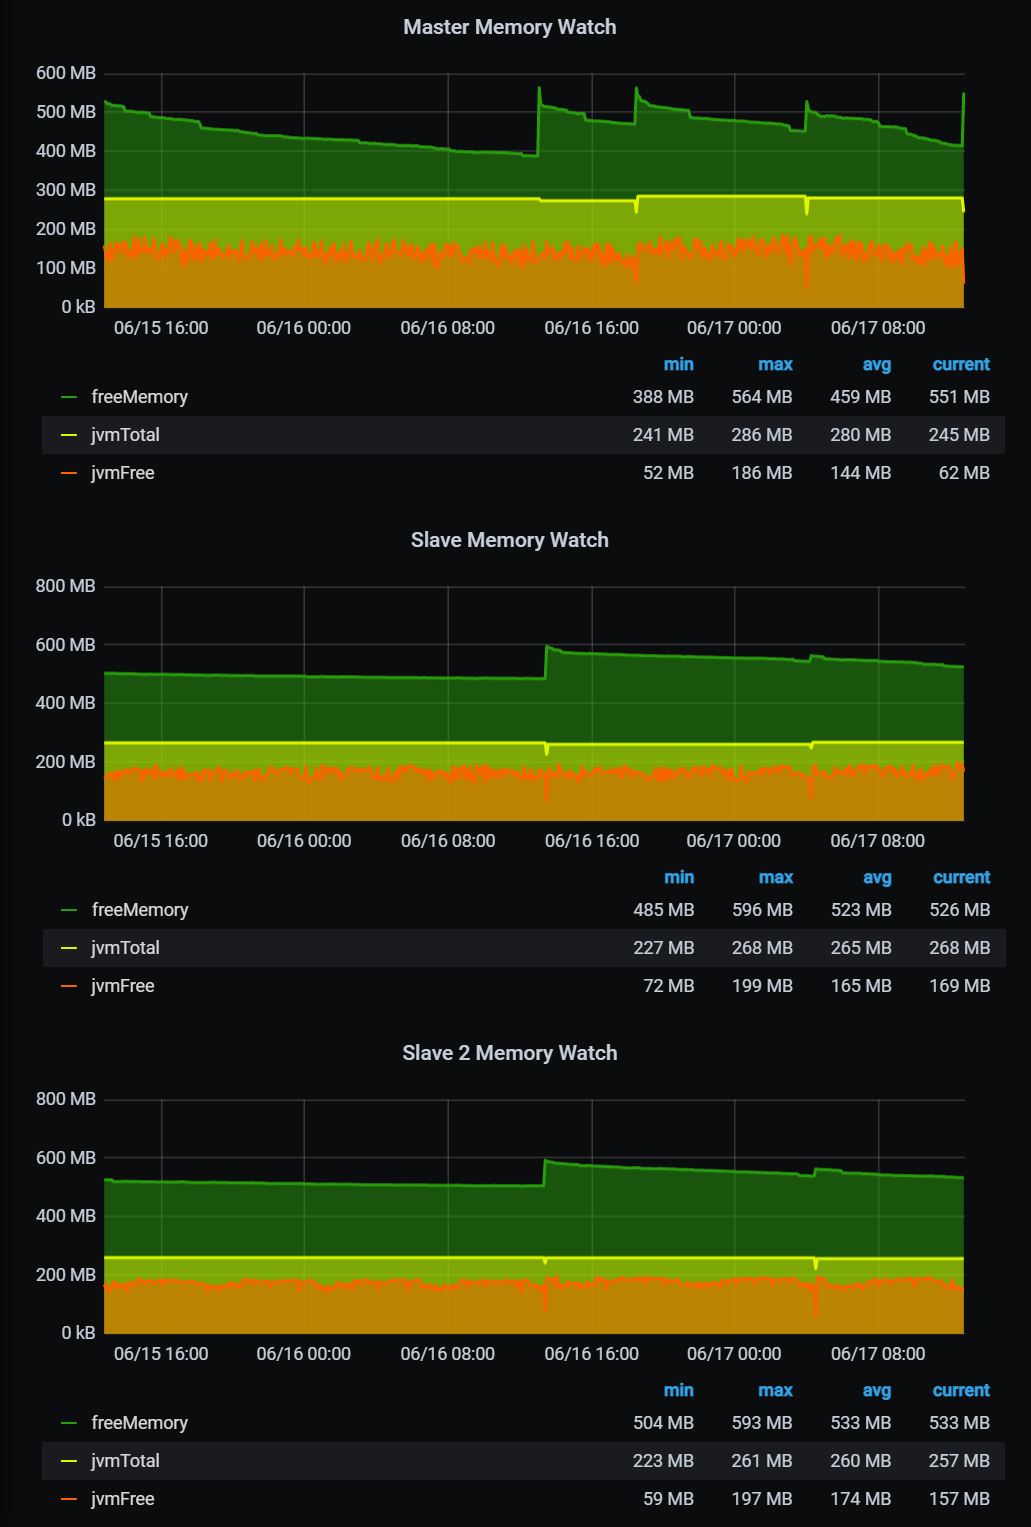
Just to add my pennyworth. I have 3 hubs the third one (Slave2) only has 4 Z Wave devices and Maker API which is sending data for me to log and all three lose free memory at different rates. My Main hub needs a reboot twice a day now!
The other two every night.
All three are on the latest firmware.
How do you track down whats causing it!
Thanks
Neil
Some memory loss is to be expected. Looking at your graphs the lowest freemem I see occurring might be in the range of 390 - well within what I would consider the good range (mine usually averages in the 290-350 range after a few days). JVM Free on your top hub on looks a little low at 67 (lot of apps running?), but the other 2 look to be in a reasonable range.
Might check the Master hub to see if it:
- Has a lot of error messages, or connections that time out
- Constantly is initiating apps/drivers
- Does a lot of polling or http calls
Just for the sake of completeness, what is your trigger for rebooting the hubs? Is it a particular memory level, responsiveness, or ???
1 Like