I’m interested in getting a temperature sensor where I can monitor my kids room temperature and plot it over time. Is that possible to log and save data like that?
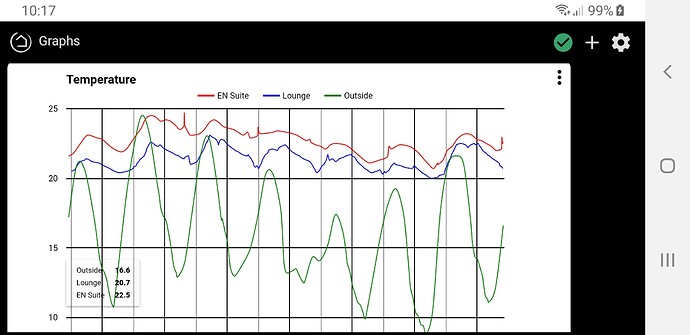
I have found the best method is using InfluxDb Logger and Grafana. These need to run on another device like a Raspberry Pi or on a NAS in a container. There is also a no longer updated community app called Hubigraph.
If you want something that does it for you, and you have a few spare $$, you could look at SensorPush. They sell sensors that measure temperature, humidity and I think Air Pressure and other reading nowadays, which can report directly to your phone / tablet and history recorded locally on the phone / tablet. You can also purchase a gateway that allows for these results to be uploaded to the cloud, if you want to access them remotely.
I've also written a driver to retrieve the results from the cloud, capturing the most recent reading into temp / humidity sensors on my HE, which, as @Slate talks about, are then ported out to InfluxDB and Grafana. Bit of a round-trip, and not something I planned to be the case, but it gives me flexibility.... if not intentional.
A 4th option would be to send the sensor data to a google sheets spreadsheet:
I personally use both Hubigraph and this 4th option. Hubigraph is super easy to setup, but has its limitations. The Google Sheets option gives you the ability to easily save and access the data long term, but is more work to setup.
Thanks for all the advice! Installed hubigraphs and I think it will do what I want to do. Hopefully updates won’t break its features. Otherwise I’ll have to try some of the other options mentioned. Thanks!
And the mother of all logging heh, just a long read. If you already have the parts laying around, this might be of interest for long term stuff.
I think this applies to most options other then Hubigraphs. You just have to have a always on server that can run an appropriate database engine (ie. mysql, MS SQL, Influxdb) and then an appropriate visualization engine with everyone seems to agree is Grafana.
Hubigraphs is fine but seems to gradually having issues with longer term retention. That isn't a problem with the systems that use a actual database like Influxdb.
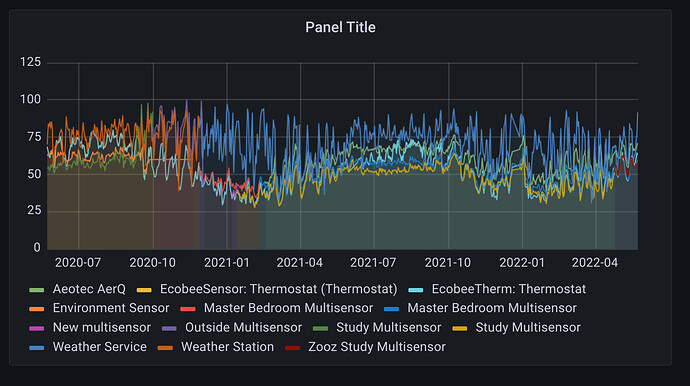
This is an example of grafana with all of the temp sensors in my house over the last 2 years. As I understand it Hubigraphs would struggle with something like this.
If you have a Ecobee thermostat and use it's room sensors connected to it. Ecobee will also do this for you as well.
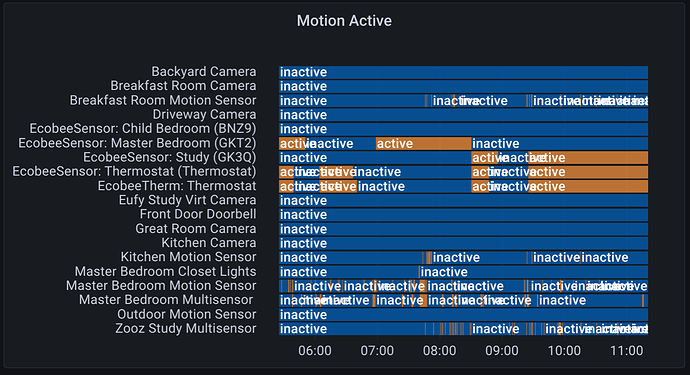
The nice thing about using a tool like influx db with grafana or Hubigraphs is that it doesn't need to be limited to just temp. You can do things like the below as well.
This is just a simple graph of when certain motion sensors saw motion.
Good luck on your solution


